

A dull rangebound summer

Quick summary:
The 2nd week of the Q3 competition is up and running - click here to join the action.
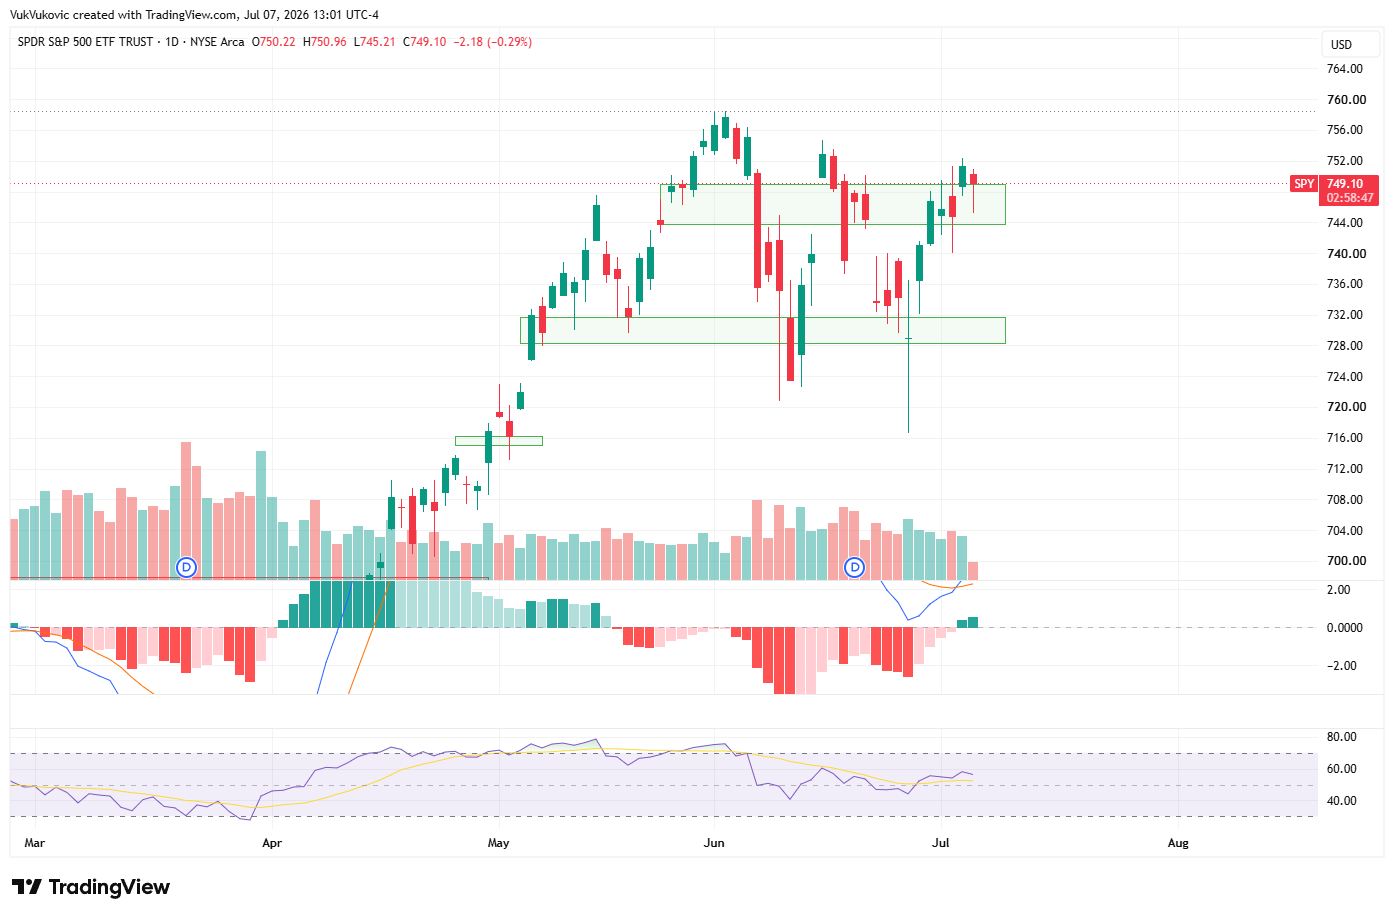
SPY is in a consolidation period as we enter July, looking to break above prior resistance to deliver a grind up for the rest of the summer. It is consolidating just below its all-time high near 760, with the broader uptrend intact (50-day above 200-day). RSI in the mid-50s to low-60s and daily MACD flattening suggest momentum is cooling, not breaking down
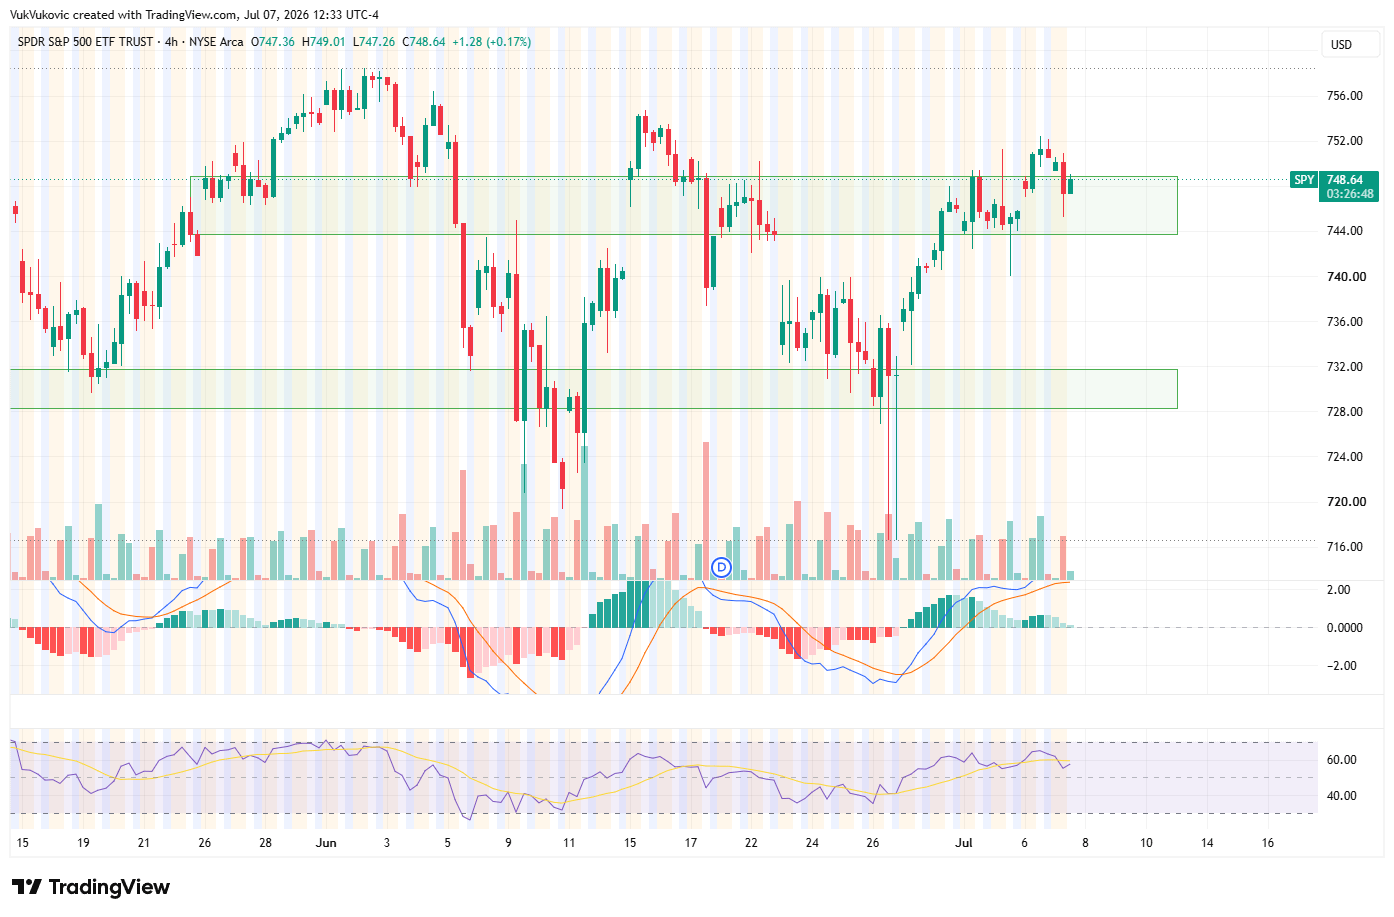
Key support sits at 740-745 (20-day average) and 722-725 (50-day); resistance remains the 757-760 shelf. 4-hour momentum has turned choppy amid a sharp semiconductor sector rotation
FOMC minutes on Wednesday, following Warsh’s hawkish tone last week, are the week’s main catalyst alongside light data (trade balance, jobless claims)
Charts
SPY enters the week hovering just below its all-time high near 760, printed back in early June, with price action last week showing the classic push-pull of a market that wants to go higher but keeps getting hit with speed bumps. On the daily chart, the structure remains constructive: the 50-day average (around 730) sits comfortably above the 200-day (around 688), keeping the longer-term uptrend intact, while price has spent the past couple of weeks consolidating in the 740-757 zone. RSI sits in the mid-50s to low-60s, meaning momentum is neither stretched nor exhausted, which leaves room to run in either direction. MACD has been flattening on the daily, a sign that the sharp thrust off the June lows is maturing into more of a grind than a breakout.
The 4-hour chart tells the more interesting story. Semiconductor stocks whipsawed hard last week, first dragging the tape lower before staging a sharp comeback into Monday’s session, and that rotation is showing up directly in SPY’s short-term momentum readings, which have flipped choppy rather than trending. Support sits first near 740-745 (the rising 20-day average), then a firmer floor around 722-725 where the 50-day comes into play. Resistance is the 757-760 shelf, the ceiling that has capped every rally attempt since early June. A clean break and hold above 760 opens the door to price discovery into uncharted territory; a failure there, paired with a slip below 740, would put the market back into a rangebound posture rather than a breakout regime.
Unless, of course, we follow this analog from 2001 (courtesy of the ORCA Macro Dashboard):
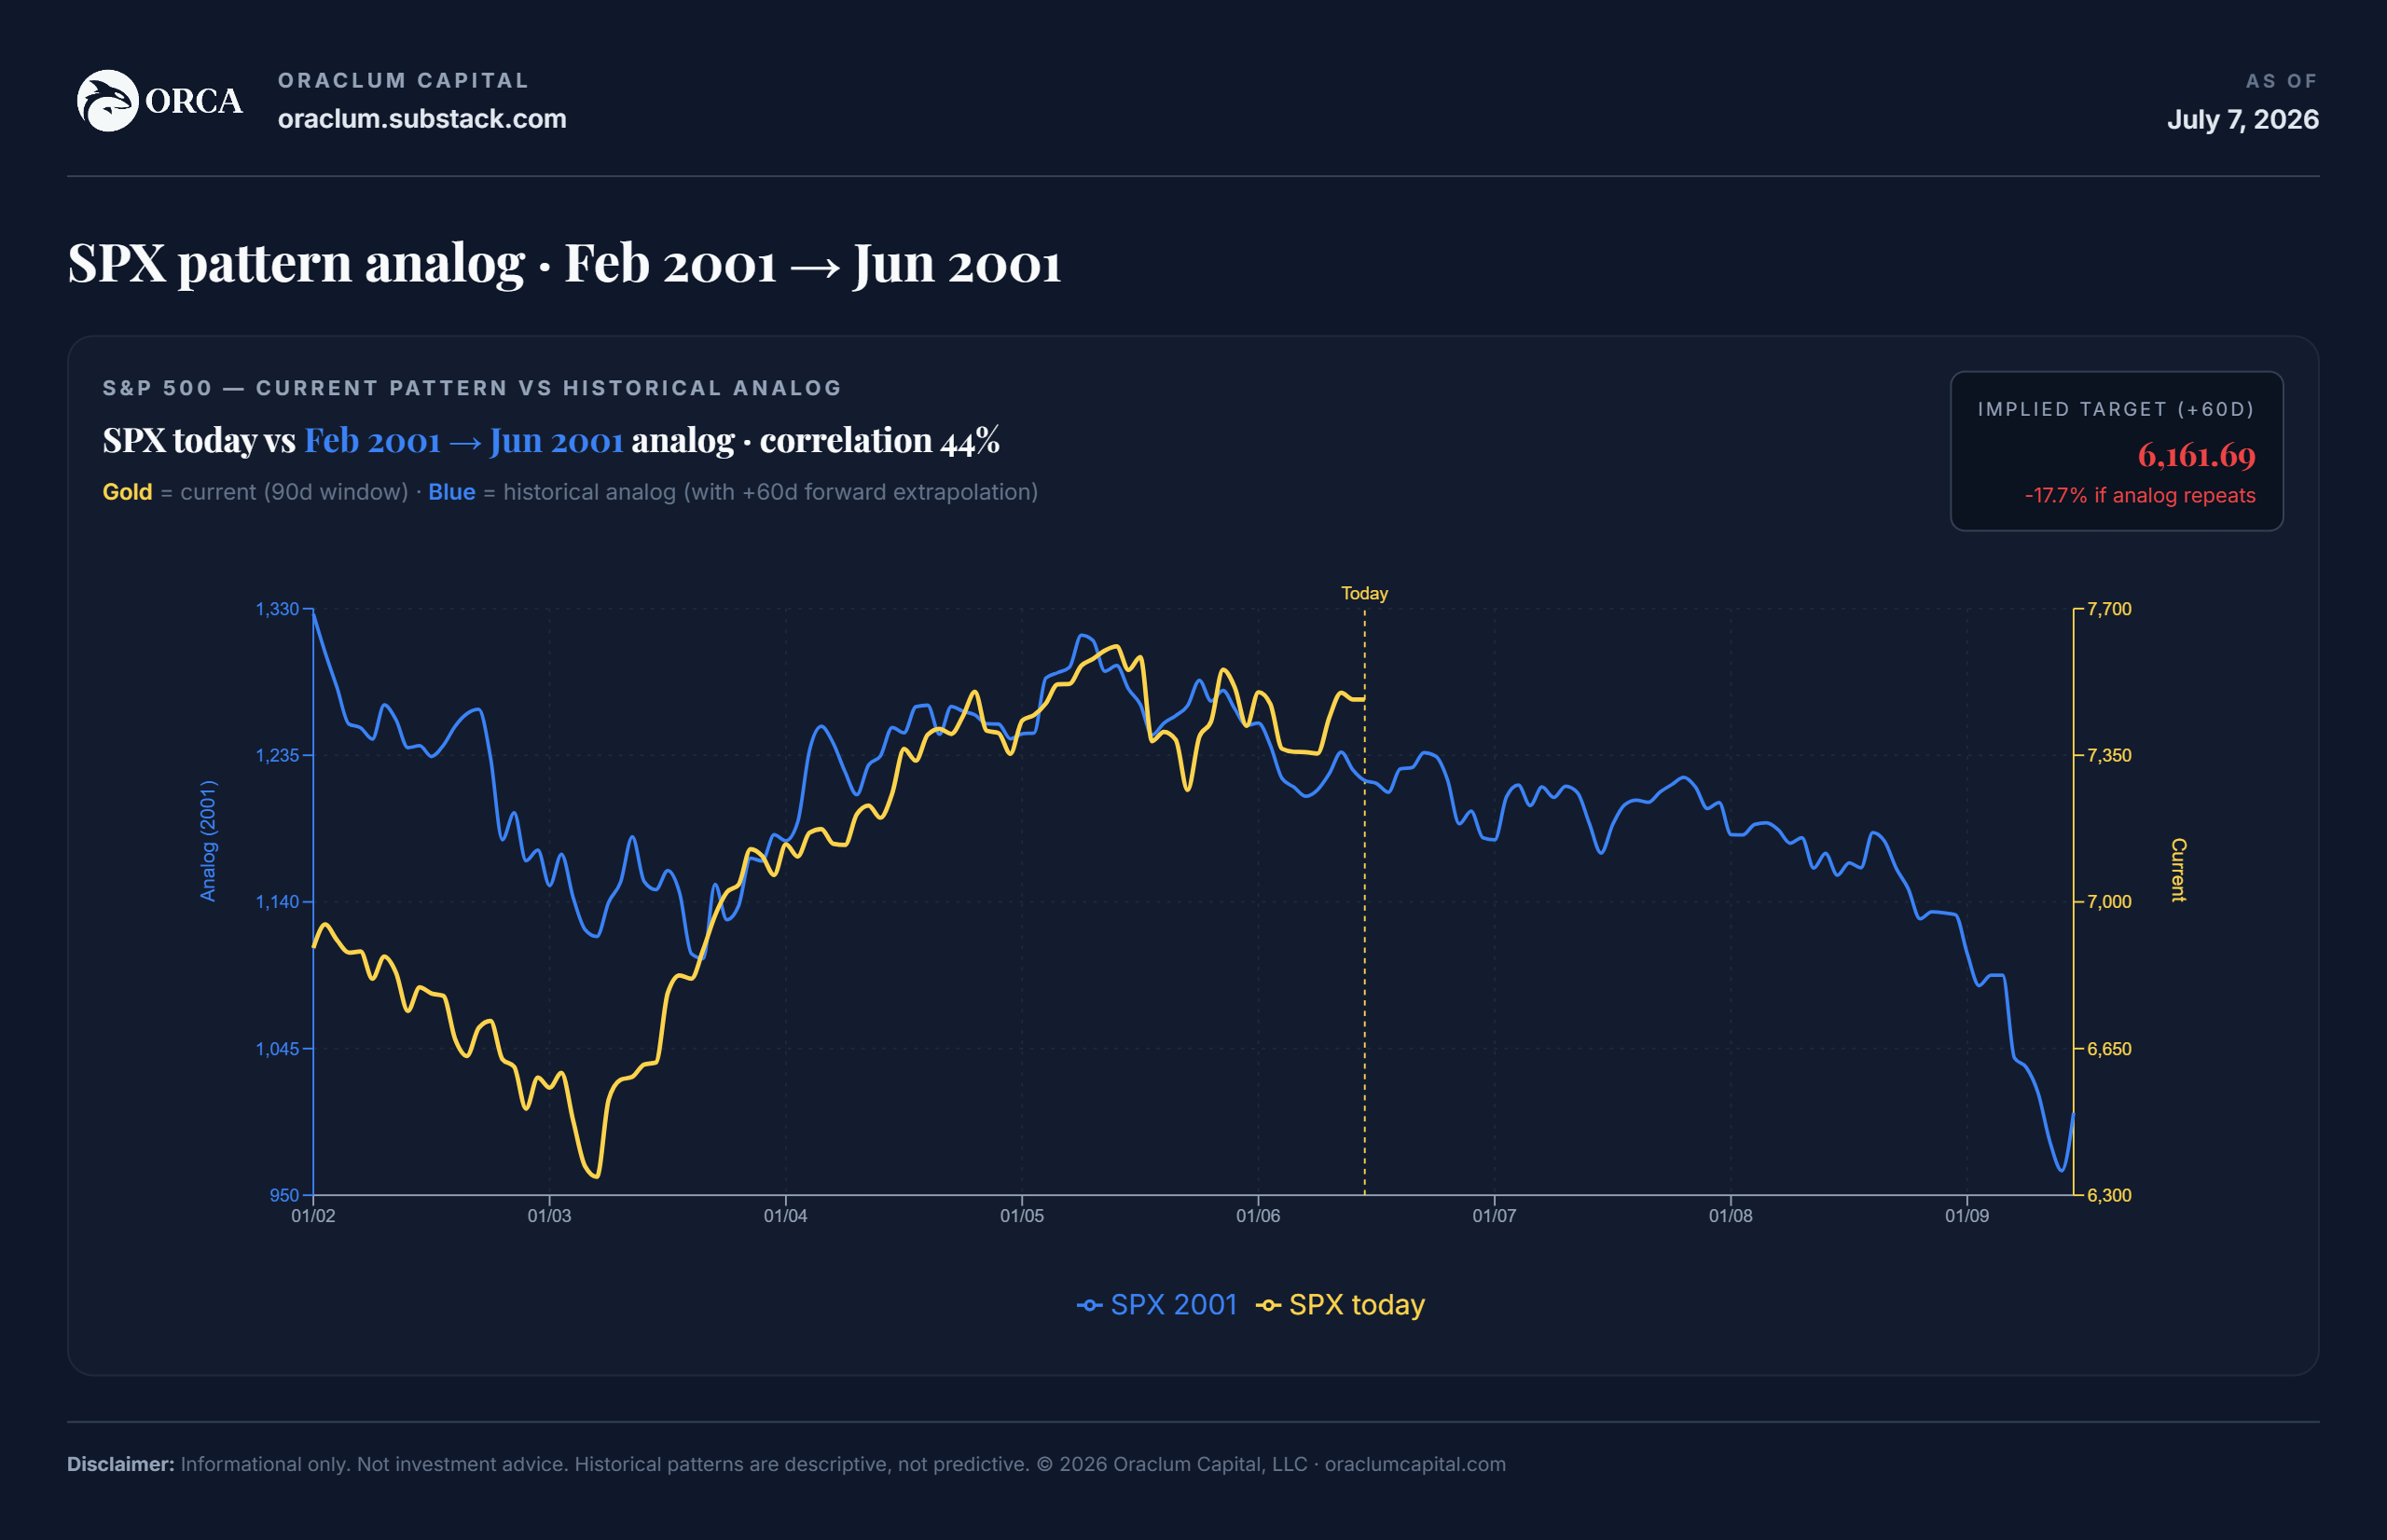
Analogs are always interesting, but in order to realize this trend over the next 60 days there would need to be some serious catalyst (e.g. FOMC?). Or, should we rather listen to this direct signal:

Your choice :)
This week’s macro calendar is comparatively light but not empty. Wednesday brings the FOMC minutes from Kevin Warsh’s first meeting as Fed Chair, which the market will comb through for hints on the rate path after Warsh’s more hawkish tone last week pushed the 10-year yield up toward 4.5 percent. Trade balance data lands Tuesday, weekly jobless claims and existing home sales follow Thursday, and earnings season is beginning to loom in the background. With no major CPI or PCE print this week, positioning around 760 resistance and Wednesday’s Fed minutes are likely to be the main swing factors for direction.
The competition
With SPY parked just under all-time highs and chip stocks whipsawing traders on the 4-hour chart, this week’s leaderboard rewards whoever called the rotation right. Keep an eye on Wednesday’s FOMC minutes, since a hawkish surprise could be the spark that finally forces a break out of this 740-760 range.
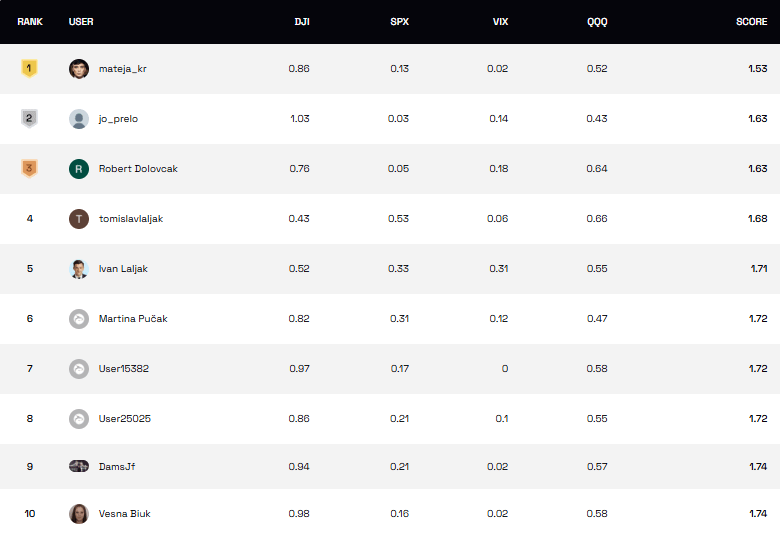
Stay focused and keep climbing the ranks!
NOTE: For all those new to the whole thing, read more about it here or watch a video of Scott and myself guiding you through the survey, showing you all its features, and briefly explaining how the competition works.
…join the $32,000x competition!
Join our survey competition to get an opportunity to participate in our quarterly ($8000) and annual (3% of our GP’s profits) prize distributions:
DISCLAIMER: Neither the survey nor any of the contents of this website can act as investment advice of any kind. The results of the survey need not correspond to actual market preferences or trends, so they should be interpreted with caution. Oraclum Capital, LLC (Henceforth ORCA) is a management company responsible for running the ORCA BASON Fund, LP, and for organizing a survey competition each week, where it invites the subscribers to its newsletter (this website) to participate in an ongoing prediction competition. The information presented on this website and through the survey competition should under no circumstances be used to solicit any investment advice, nor is it allowed to be of commercial use to any of its readers. The survey and this website contain no information that a user may use as financial or investment advice. All rights reserved. Oraclum Capital LLC.
And, as always, don’t forget to subscribe to the newsletter.