


Bullish 🐂 or bearish 🐻?
Analyzing both sides of the argument

A little break from predictions, and something to reward all those readers looking for clarity in the markets - a nice, long, Easter weekend read.
Or, if you just want the quick info, this thread will suffice:

The bears 🐻
Let's start with the bearish arguments.
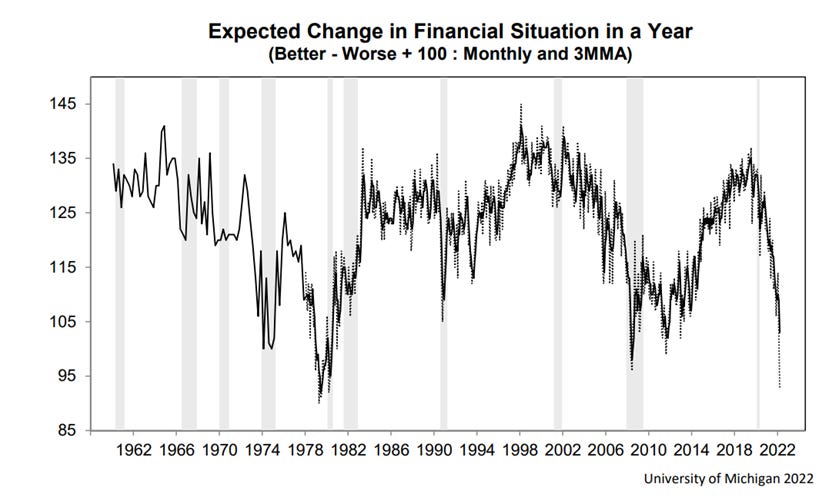
It has become obvious to most people by now that rampant inflation is killing consumer confidence, which is down to recession-time lows, in both the US and across the EU. Usually consumers are this depressed when a recession is already underway, or - as in the 1970s - when it’s combined with stagnation and inflation.


Consumer expectations on their financial situation one year from now are close to all time lows in the US. The 3-month moving average is worse than during the Great Recession, and very close to the 1970s stagflation times. The same indicator in the EU is worse than it was during the sovereign debt crisis and during height of the COVID uncertainty. It’s safe to say that a lot of people forgot what it feels to have high(er) inflation on their hands. It’s not a good feeling, that’s for sure!
Inflation is pressuring the bond markets as well. Given that inflation has been here for a year now, longer than initially anticipated and unfortunately not yet peaking, low yields on bonds are no longer attractive, so a lot of bond selling is happening.
This, in turn, is causing a yield curve inversion, the fastest ever of the 10Y2Y spread since the Fed started raising interest rates. It took only 2 and a half weeks for it to invert, whereas usually it takes over a year for market expectations to adapt.
Recall from one of our earlier texts why a yield curve inversion is an important indicator here.


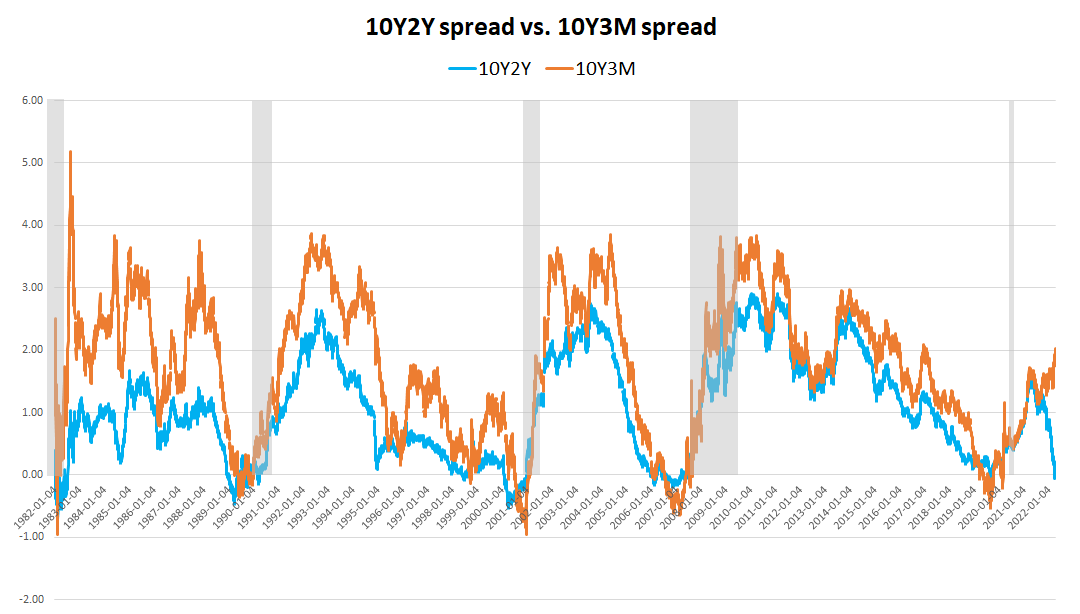
Some analysts are saying that the 10Y2Y spread is not a good indicator to use any more (the this-time-is-different narrative), and that the 10Y3M spread (spread between the 10-year and the 3-month Treasury yields) is a much better forward-looking indicator of recessions. And the 10Y3M has been moving in the opposite direction, steepening instead of inverting.
However, as you can see from the figure below, the 10Y2Y spread (in blue) typically drives the 10Y3M spread (orange). It is thus a better forward-looking indicator. Currently, we have a separation of the trends, something that last happened in 1994 (which was the only time the Fed raised rates without causing a recession - also note the curves hadn’t inverted back then).
However, don’t read too much into this separation. Why? Because the 3-month yield is tied to the Federal funds rate - both are sitting at 0.5% right now.
Also, remember that the Fed is expected to hike 7-8 times this year reaching 2% or maybe even 2.5% by the end of the year. When that happens, expect the 3-month rate to go up to 2 or 2.5%, and then we will very much have an inversion of the 10Y3M spread as well.
Note the correlation between the two being almost 1-to-1, but also note how the 2-year yield is typically leading an increase in these rates as well. In other words, whenever the 2-year Treasury yield goes up, interest rate hikes will follow.
This is why investors like the 2Y-10Y spread, and the 3M-10Y spread that typically follows suit.

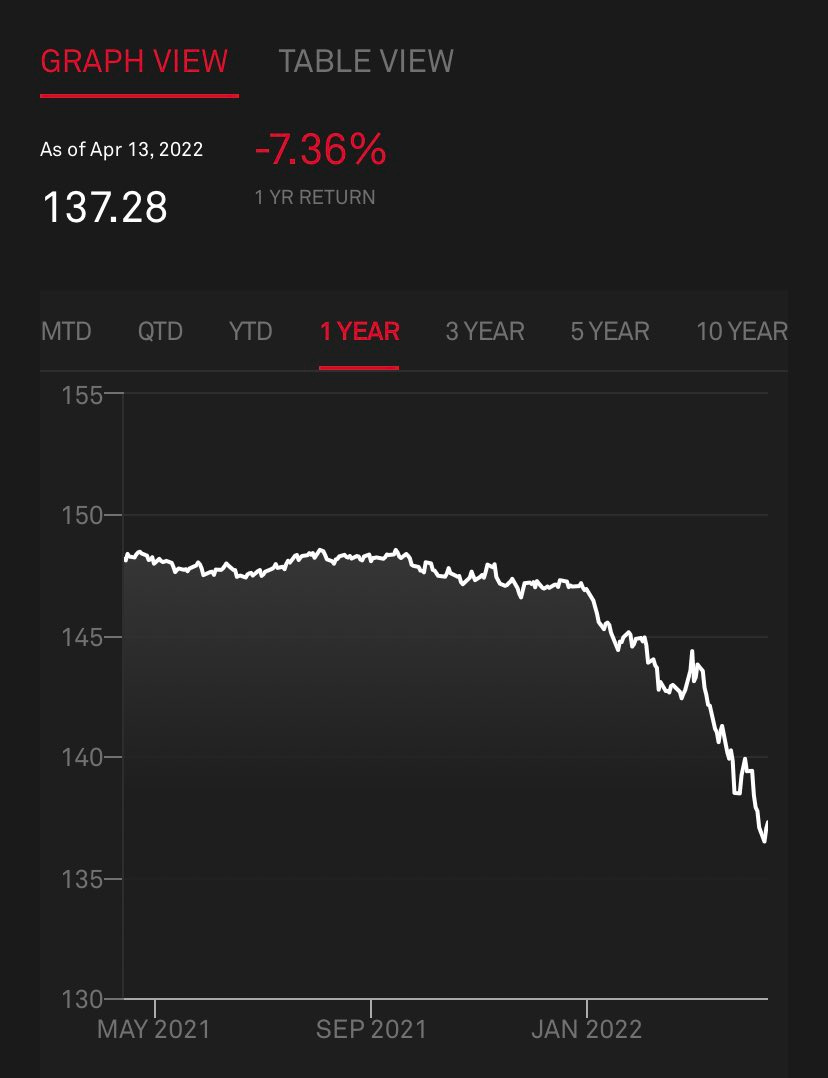
Next we have the mortgage rates. The 30-year fixed rate is already over 5%. Again, a very sharp increase. When interest rates go up, the mortgage rate is typically the first to react, followed by credit card rates. This means that consumers are left with less disposable income which means they spend less. As they spend less, firms will earn less, and their earnings will go down. This is why markets are sensitive to rate hikes, especially in the tech sector (see my thread explaining this).

The banks are not helping. Credit impulse for G3 (US, China, EU) measures the change in the flow of credit to firms and households. This typically leads global manufacturing by 12 months. And it's going down sharply, meaning that it could take down manufacturing with it.

Then there is the matter of the housing bubble. The Case-Shiller Index is 50% *higher* than the 2006 bubble peak. Rents and home prices in some cities are insane. Again, many are saying that this time is different: leverage is now lower, households are better off (share of disposable income going to debt repayments is half the rate as in 2007), almost everyone now has fixed mortgage rates, so only new buyers are affected by rate increases, not the existing homeowners, etc. However, I do recall similar arguments being made in 2006, somewhere in the line that housing is “the bedrock of the US economy”, and that it will never collapse.

To add insult to injury, I had a look over at the ABX, the US mortgage-backed securities index, the one that tracks the health of subprime mortgages. You know, the one that John Paulson and Michael Burry shorted back in 2006 (among other things) and made billions. When it declines, this is typically an indication that “the market associates more risk with subprime mortgages”. And it’s down 7% since its 2021 peak.
(Btw, when this started going down in 2006, it went down 5 points in a single day, Paulson made his first $1.25bn that day. Read more in Zuckerman: The Greatest Trade Ever)
Inflation is further exacerbated by the Ukraine invasion. There was a spike in oil & gas prices which now subsided. But consumers & firms will still feel this in the months to come, just like they did with iron and lumber - they peaked in mid-2021 (see the bottom two indicators on the graph below), and we started to see inflation after their prices already adjusted downwards.

The same will now be for food and energy. For example, notice the spike in wheat prices or coal. We are yet to feel this on future food prices. In other words, we won't get rid of inflation just yet.

The bulls 🐂
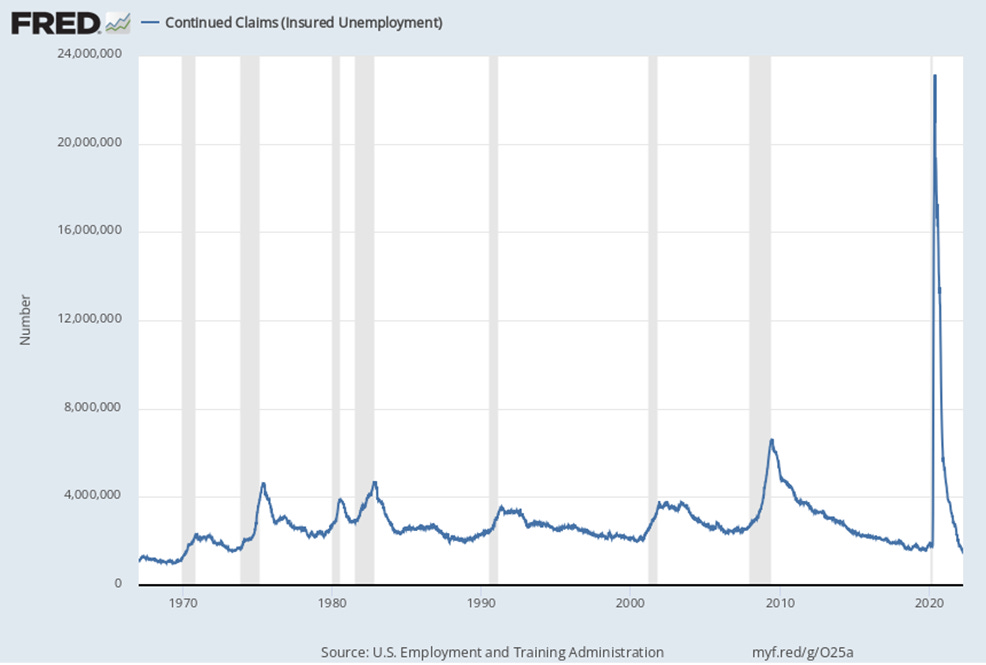
Now for the bullish side. Despite their concerns, consumers are still spending a lot (consumption is still largely unaffected), and unemployment (albeit a lagging indicator) is down to all time lows. Plus, total hours worked is high, and unemployment claims all-time low, both being somewhat leading indicators for the economy. The labor market, therefore, is quite robust.
All the standard leading economic indicators are also showing signs of a strong economy. E.g. new building permits issued or manufacturers' new orders.

The Conference Board's Leading Economic Index (LEI) captures all these standard leading indicators, and it's going up in February, not down (March data still pending).
Then there are the tech giants - AAPL, MSFT, GOOGL, AMZN and TSLA - whose underlying performance has continued to be stellar. It’s hard to find a bearish argument against each of these individually. And keep in mind that together they constitute a quarter of the S&P500 index. Also, most of them have been driving the S&P in recent years via stock buybacks - 40% of its return came from buybacks. And the buybacks are anticipated to set more records in 2022.


Although, one could argue that in the short run, big tech will suffer from rate hikes, plus rising labor costs etc., and will therefore scale back on the buybacks. But thus far, we haven't seen too many signs of this.
Finally, when a lot of people are bearish (SPY and QQQ puts are being bought en masse), isn't that a good time to be contrarian? :)
To quote George Soros (Alchemy of Finance, pg. 315):
"...financial markets constantly anticipate events, both on the positive and on the negative side, which failed to materialize exactly because they have been anticipated."
"...financial crashes tend to occur only when the are unexpected."
Verdict?
The bond market signals are too strong to ignore. I kept saying in this blog over and over than you should only worry after seeing the yield curve invert. And it has inverted sharply, with 7 or 8 more rate hikes still to go.
Personally, this makes me more bearish, but I've adapted my equities portfolio to benefit from large moves either up or down. With the usual safeguards in place, of course. Plus, long on commodities ETFs, (still) short on bonds.
Let's see how it plays out.
Thanks for reading and feel free to share with your friends:
TSLA still has too much demand despite inflation. I guess inflation in fuel prices drive consumers to buy Tesla’s instead of legacy ICE vehicles. Thank you for putting this out. I enjoy reading your articles every time.