

Charts: bearish confirmation?

Quick summary:
2nd week of the Q1 competition is up and running - click here to join the action.
SPX has, over the weekend, pushed below a key support area. Over-the-weekend political uncertainty over Greenland and tariffs started a strong sell-off in futures.
Previously, intraday pullbacks have been met with demand near prior resistance, an important signal as the market tests whether this breakout can hold. It didn’t.
With markets reopening after yesterday’s Martin Luther King Jr. holiday, attention now shifts to how price reacts to all this uncertainty as liquidity returns and macro data comes into focus.
Charts: breakout below support, will it be confirmed?
Markets were closed yesterday due to MLK Day in the US, but futures were skydiving following the political uncertainty over Greenland and Trumps’s announcements of tariffs against EU countries that sent military support to Greenland. Things are heating up, markets are hating it, and a sell-off was a natural consequence.
Overnight, we broke through this entire resistance zone (blue level) from earlier (see SPY 4-hr chart below). Just as we were hoping for it to become resistance and confirm an upward trajectory, political uncertainty made the whole thing redundant.
So now we wait for confirmation on the other side. What does that mean?
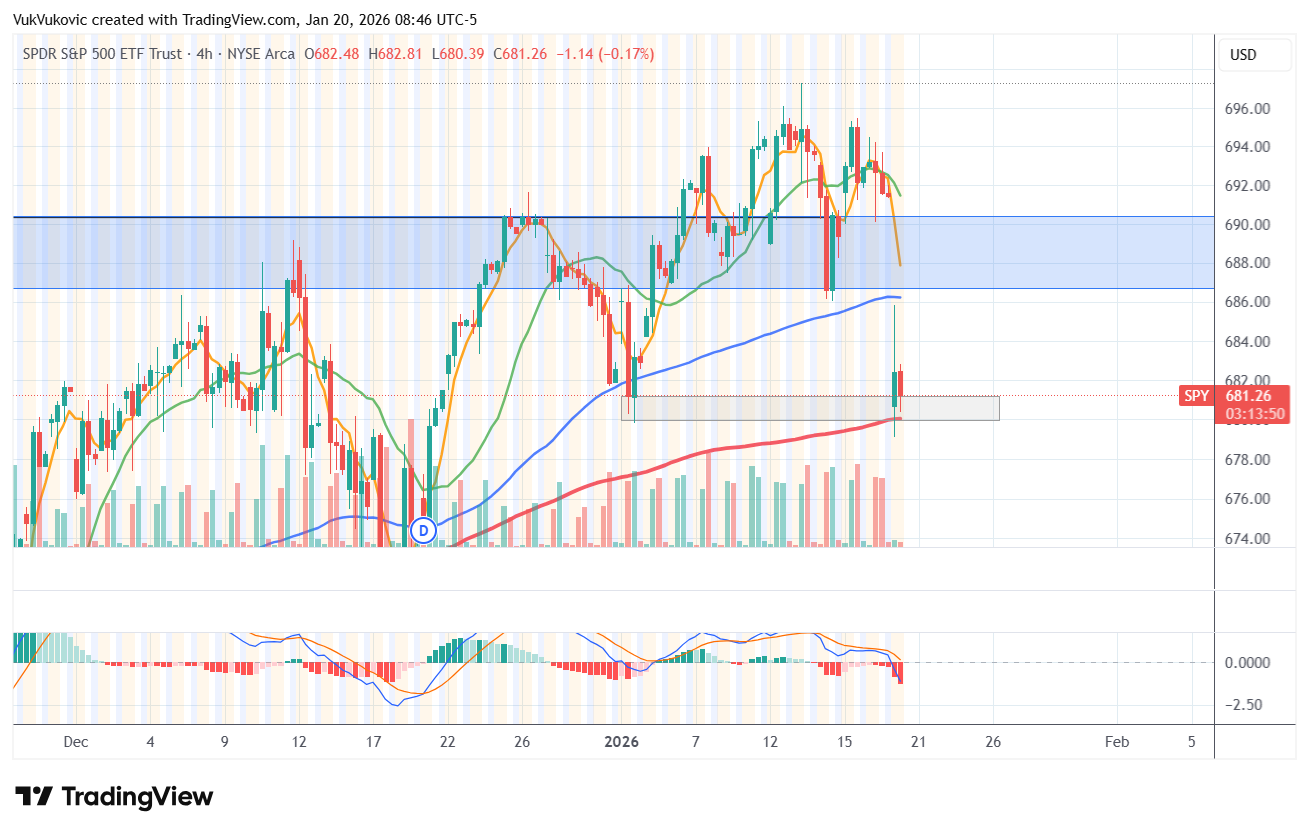
Well, if SPY bounces back to 686-ish, and fails to clear the prior resistance, meaning fails to jump back up above it, this would signify a bearish confirmation to the downside and we can expect the sellers to reengage at that level.
What does that confirmation look like?
Let’s get down to a lower time frame. On the 30-min chart (or 15-min), this would look like the following: price goes up to around 686, and just as it attempts to break back into the blue zone, we get a big red candle, and then another one and a move back down is confirmed.
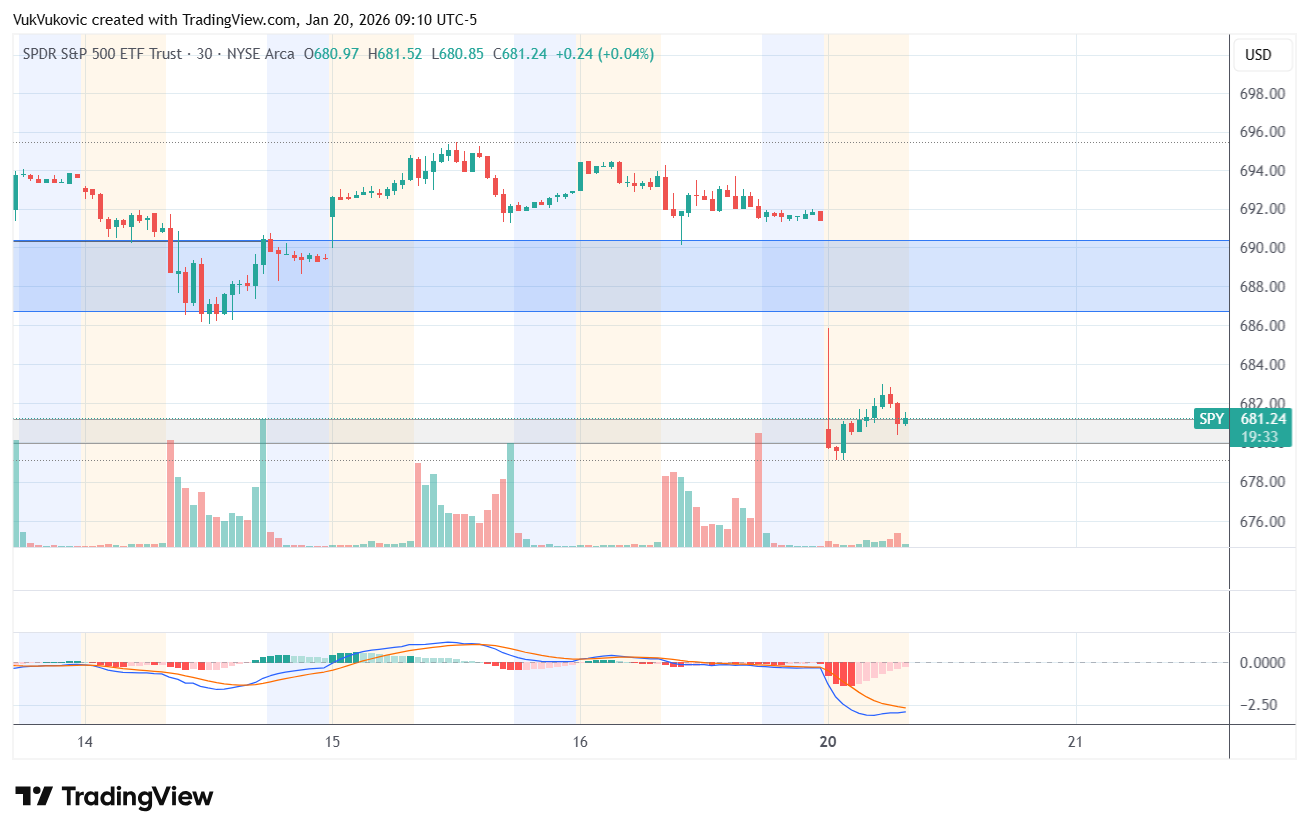
However, beware, because there is also a zone of resistance below (the gray zone). We can easily break below this one before getting any move back up. It works the same way, break below, wait for it to come back and if it then continues going down, this is confirmation to the downside.
In any case, watch all the levels from above - we might get a bullish move from that 681 area after open. If so, then we watch if it breaks 686. If not, if it backs down, this is first confirmation. Then the next level to break below is back to 681 again.
Ahead of Wednesday’s predictions, today’s price action might be very useful.
In terms of pure momentum, the weekly, daily, and 4 hour MACD have all turned bearish. This alignment does not guarantee continuation, but it does argue against fading the move prematurely.
That puts the focus squarely on how this setup resolves over the coming days. With price sitting at a key inflection point, the next move is likely to be driven less by the charts themselves and more by the flow of macro and political information.
It is a shortened trading week due to the Martin Luther King Jr. holiday, but there are still several events that could influence direction. Inflation data and broader policy signals remain in focus as markets continue to assess the outlook for growth and rates. In an environment where momentum has already cooled from last year’s extremes, reactions at key technical levels may matter more than the headlines themselves.
The competition
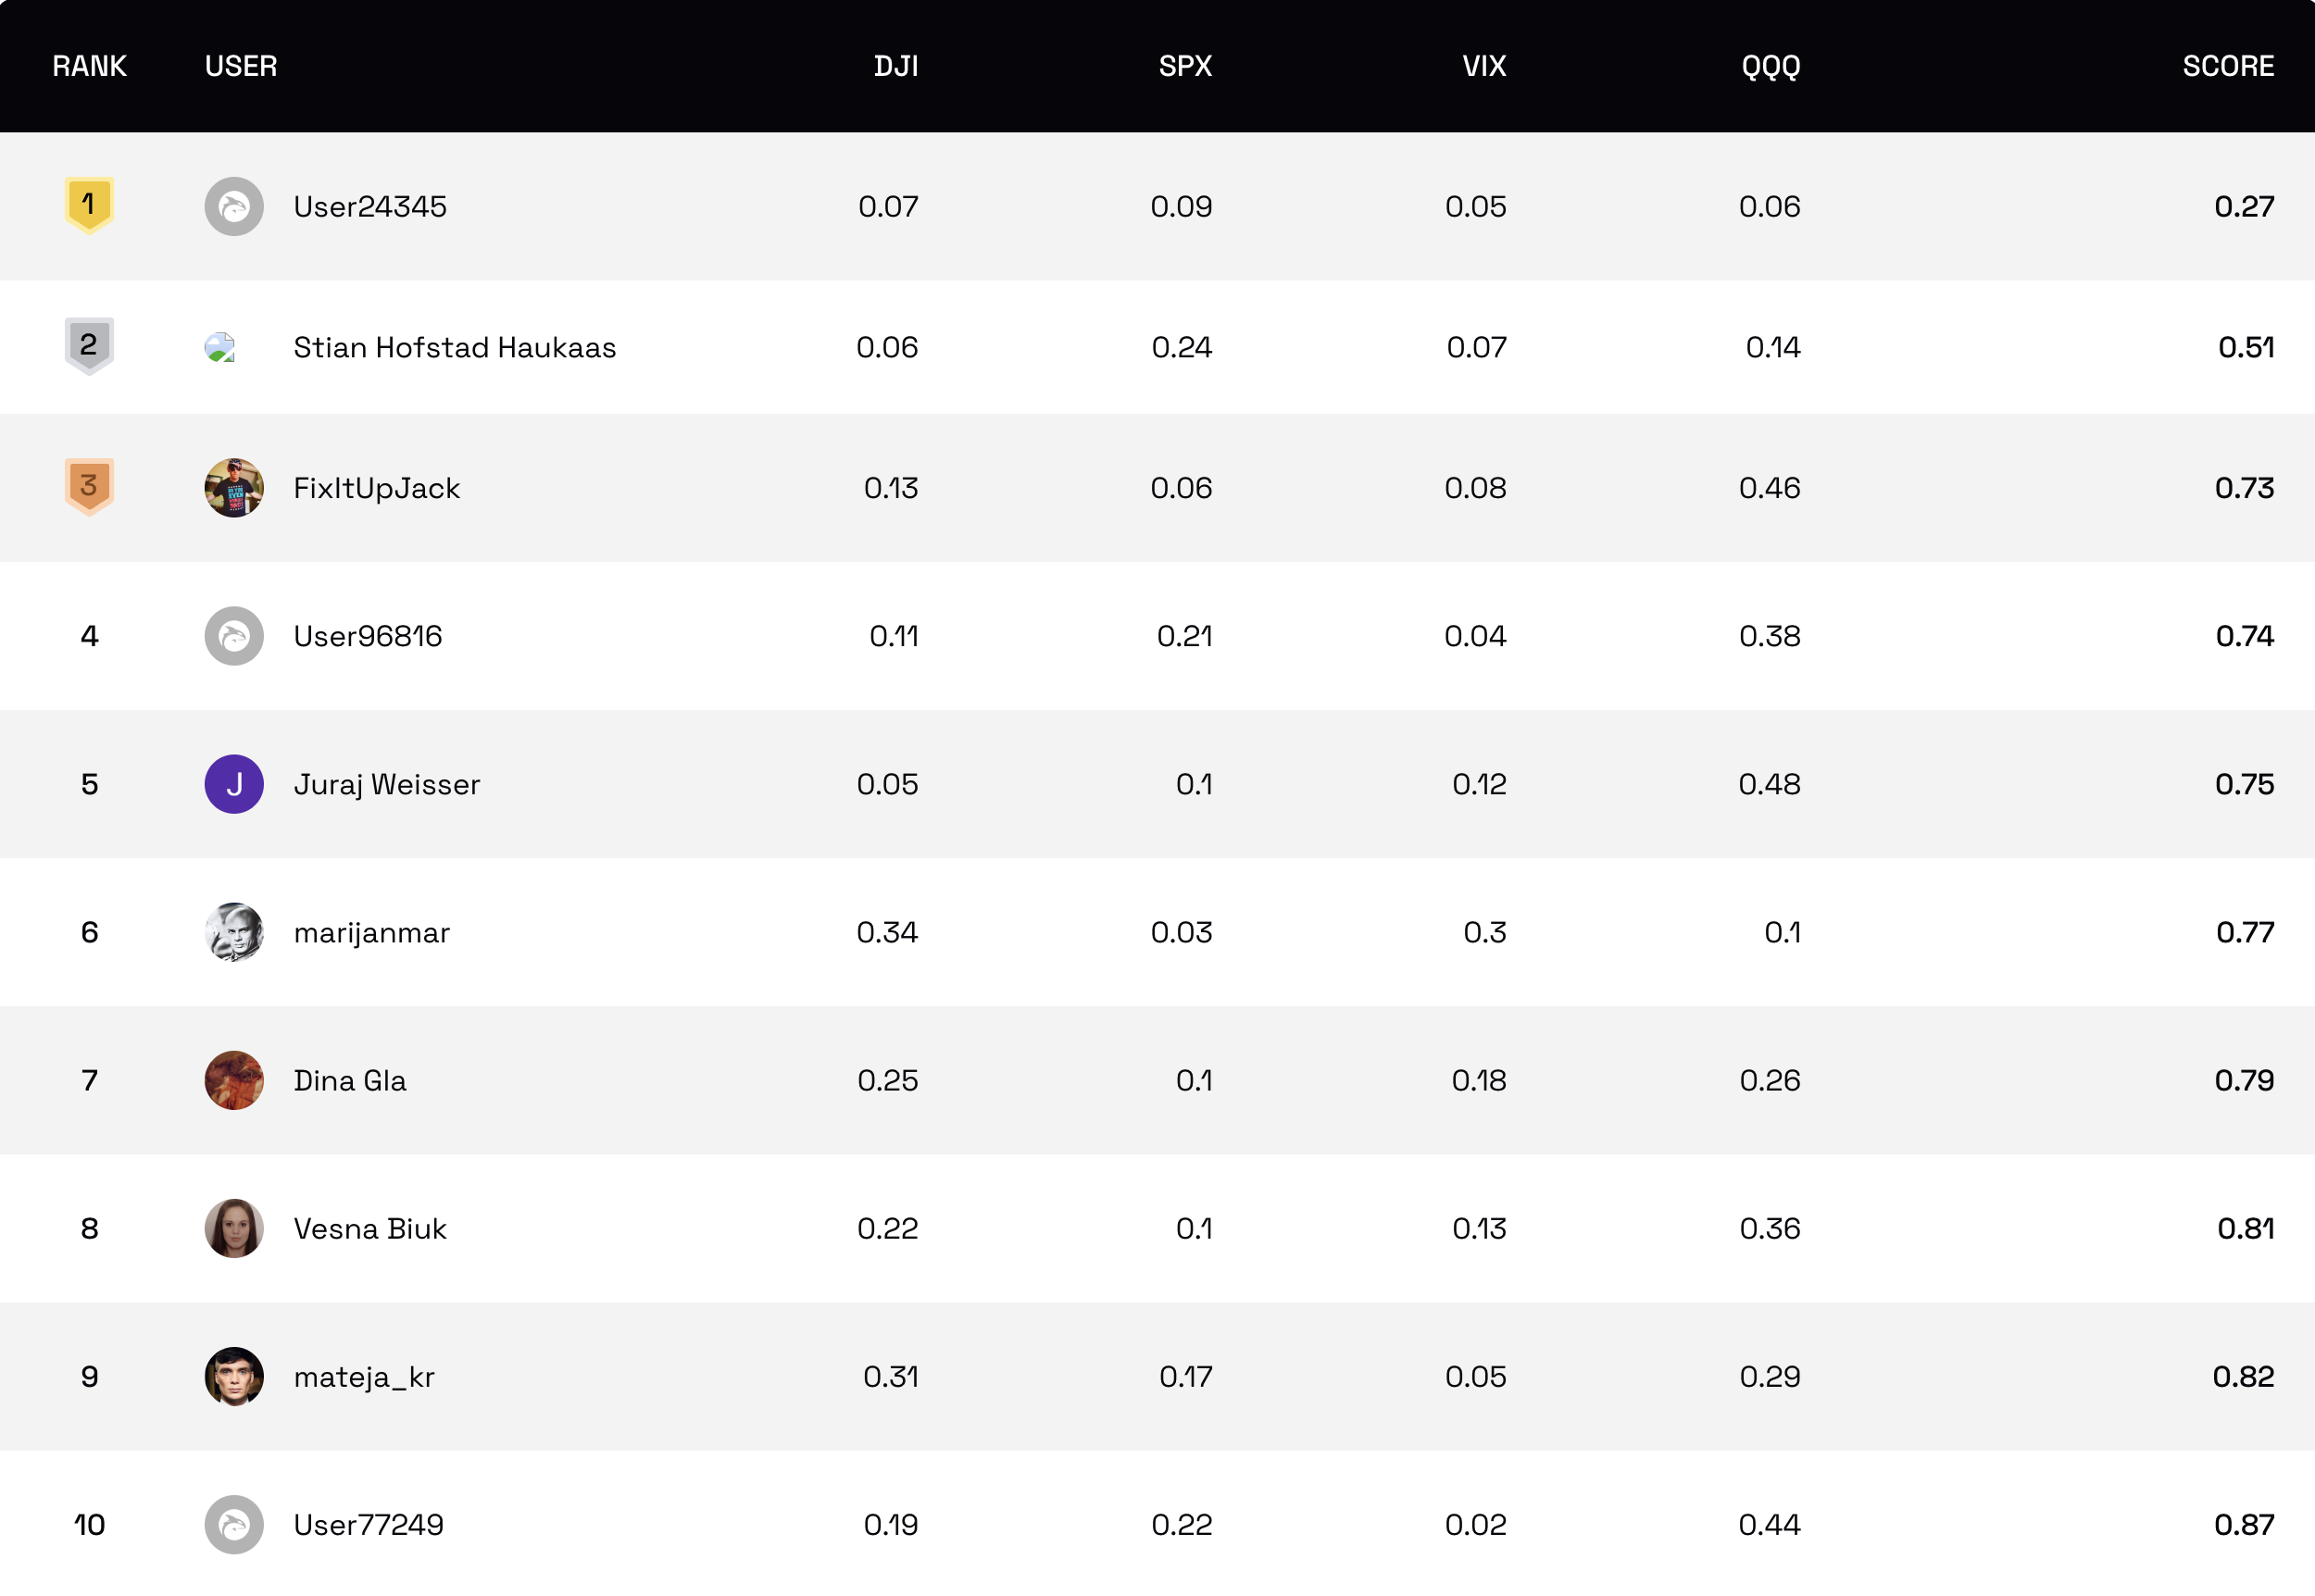
As liquidity returns after the long weekend and markets react to key macro signals, the leaderboard is starting to show how the field is setting up.
Stay focused and keep climbing the ranks!
NOTE: For all those new to the whole thing, read more about it here or watch a video of Scott and myself guiding you through the survey, showing you all its features, and briefly explaining how the competition works.
…join the $32,000x competition!
Join our survey competition to get an opportunity to participate in our quarterly ($8000) and annual (3% of our GP’s profits) prize distributions:
DISCLAIMER: Neither the survey nor any of the contents of this website can act as investment advice of any kind. The results of the survey need not correspond to actual market preferences or trends, so they should be interpreted with caution. Oraclum Capital, LLC (Henceforth ORCA) is a management company responsible for running the ORCA BASON Fund, LP, and for organizing a survey competition each week, where it invites the subscribers to its newsletter (this website) to participate in an ongoing prediction competition. The information presented on this website and through the survey competition should under no circumstances be used to solicit any investment advice, nor is it allowed to be of commercial use to any of its readers. The survey and this website contain no information that a user may use as financial or investment advice. All rights reserved. Oraclum Capital LLC.
And, as always, don’t forget to subscribe to the newsletter.
Sharp call on the 686 breakdown. The alignment of weekly/daily/4hr MACD turning bearish simultaneously is worth noting, even if momentum alone dosnt guarantee continuation. What caught me is how quickly prior resistance flipped to failed support,the kind of shift that often precedes deeper moves when macro uncertainty is already elevated.
Trump is in action again....he already gave us a few "lessons" last year, I hope this will be easier to "balance"...