

Higher for longer, FTW!

A quick note before we start: for the next two months the whole newsletter is unlocked - all the layers go out free, to everyone. I’ve labeled which part is normally which so you can see exactly what each tier buys you. For example, the Premium section below is the kind of depth you want every week and when necessary on a daily basis (plus the monthly calls from early September onwards) - that’s what the $120 tier is.
Read it for the next two months and see what value it brings.
Also, next week, before the SpaceX IPO, I’ll do a quick analysis on it, as part of what is usually the Premium package. Also free for now, before we lift the paywalls again on August 1st. There is a bunch of things floating around this IPO (pun intended!) so I wanna do some mythbusting around it, and discuss the narrative implications that will keep the stock bouncing - both from an institutional and a retail side.
Oh and yes, expect longer, research-oriented posts. Enjoy!
First up, employment report.
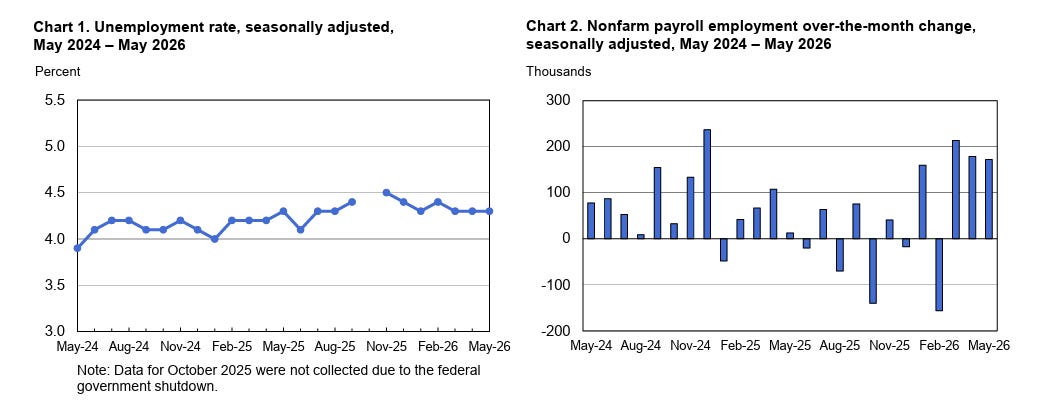
May payrolls came in at 172,000 against an expected 85,000. Unemployment stayed at 4.3%. All those concerns about the labor market from H2 last year should be alleviated by now. Even after the oil shock, and all the structural instabilities we read about during the past two three quarters, the economy is still doing great, the labor market is stable, and the AI productivity impact is alive and well. Furthermore, ISM Manufacturing printed 54.0 in May, its highest since 2022, with New Orders at 56.8 and a fifth straight month of expansion. Earnings are tracking +22% for the year. GDPNow is at 3%. That is certainly not a slowdown.
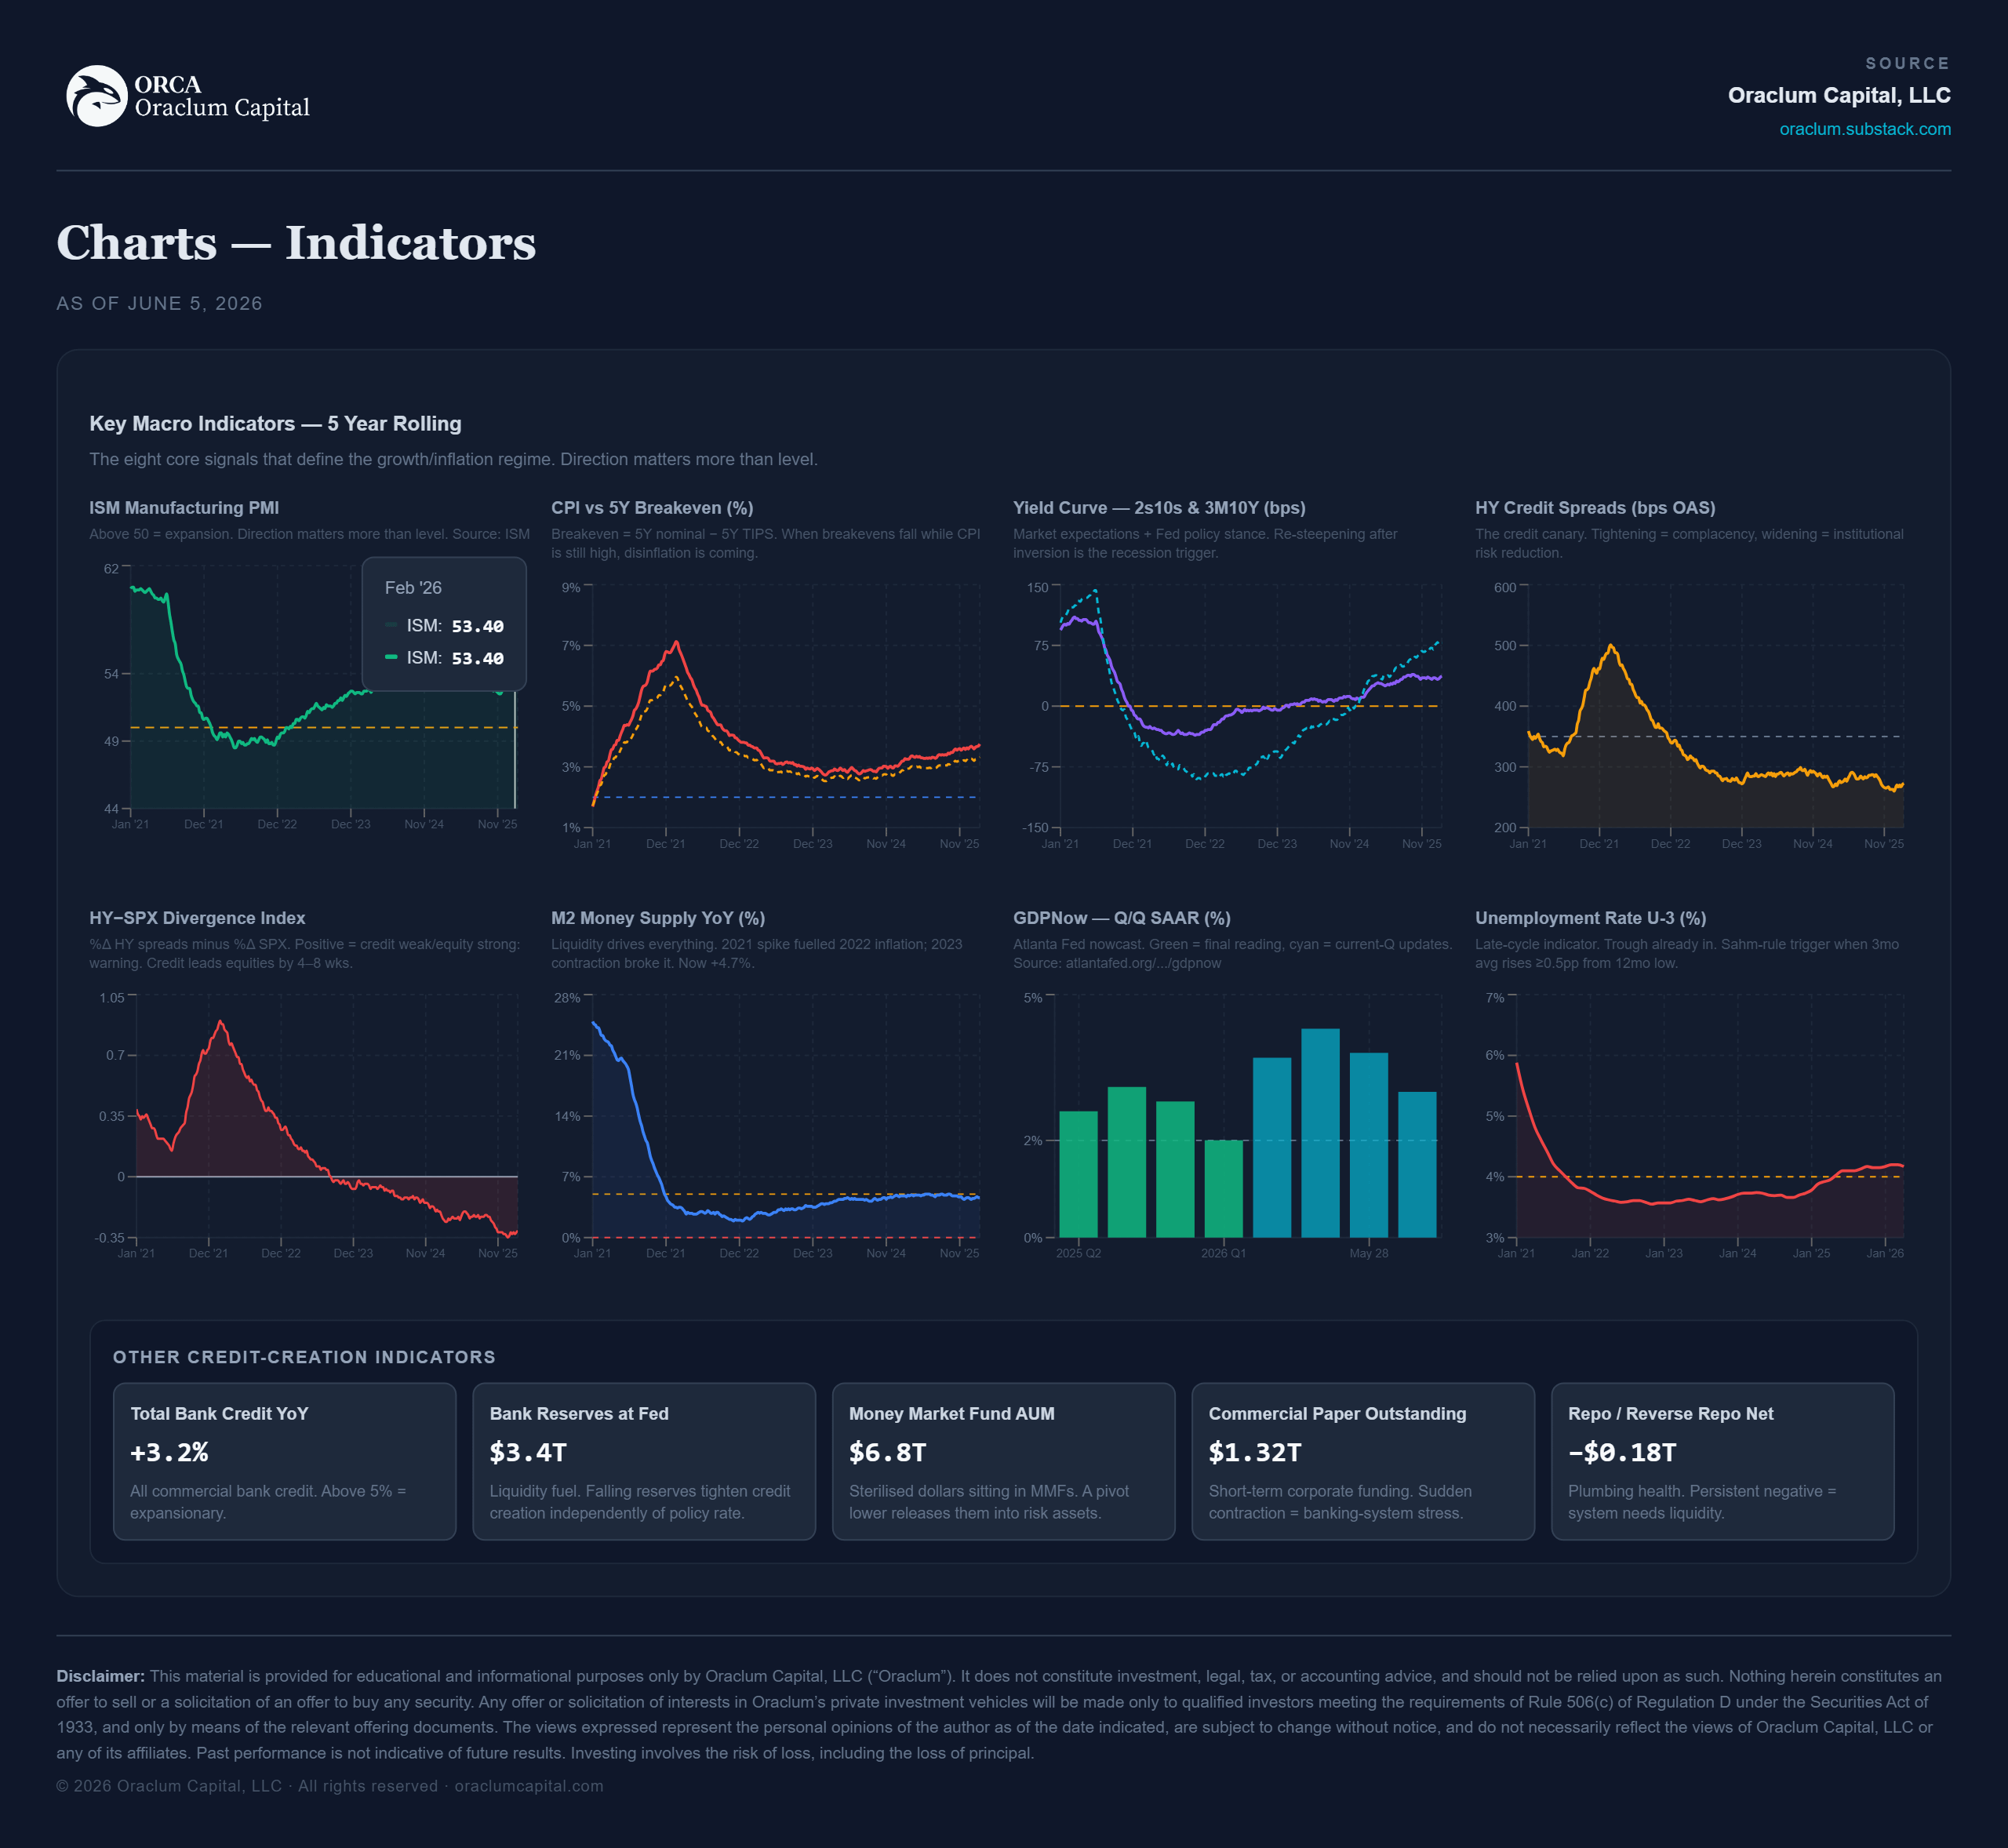
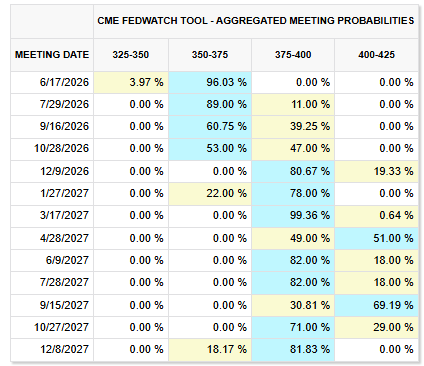
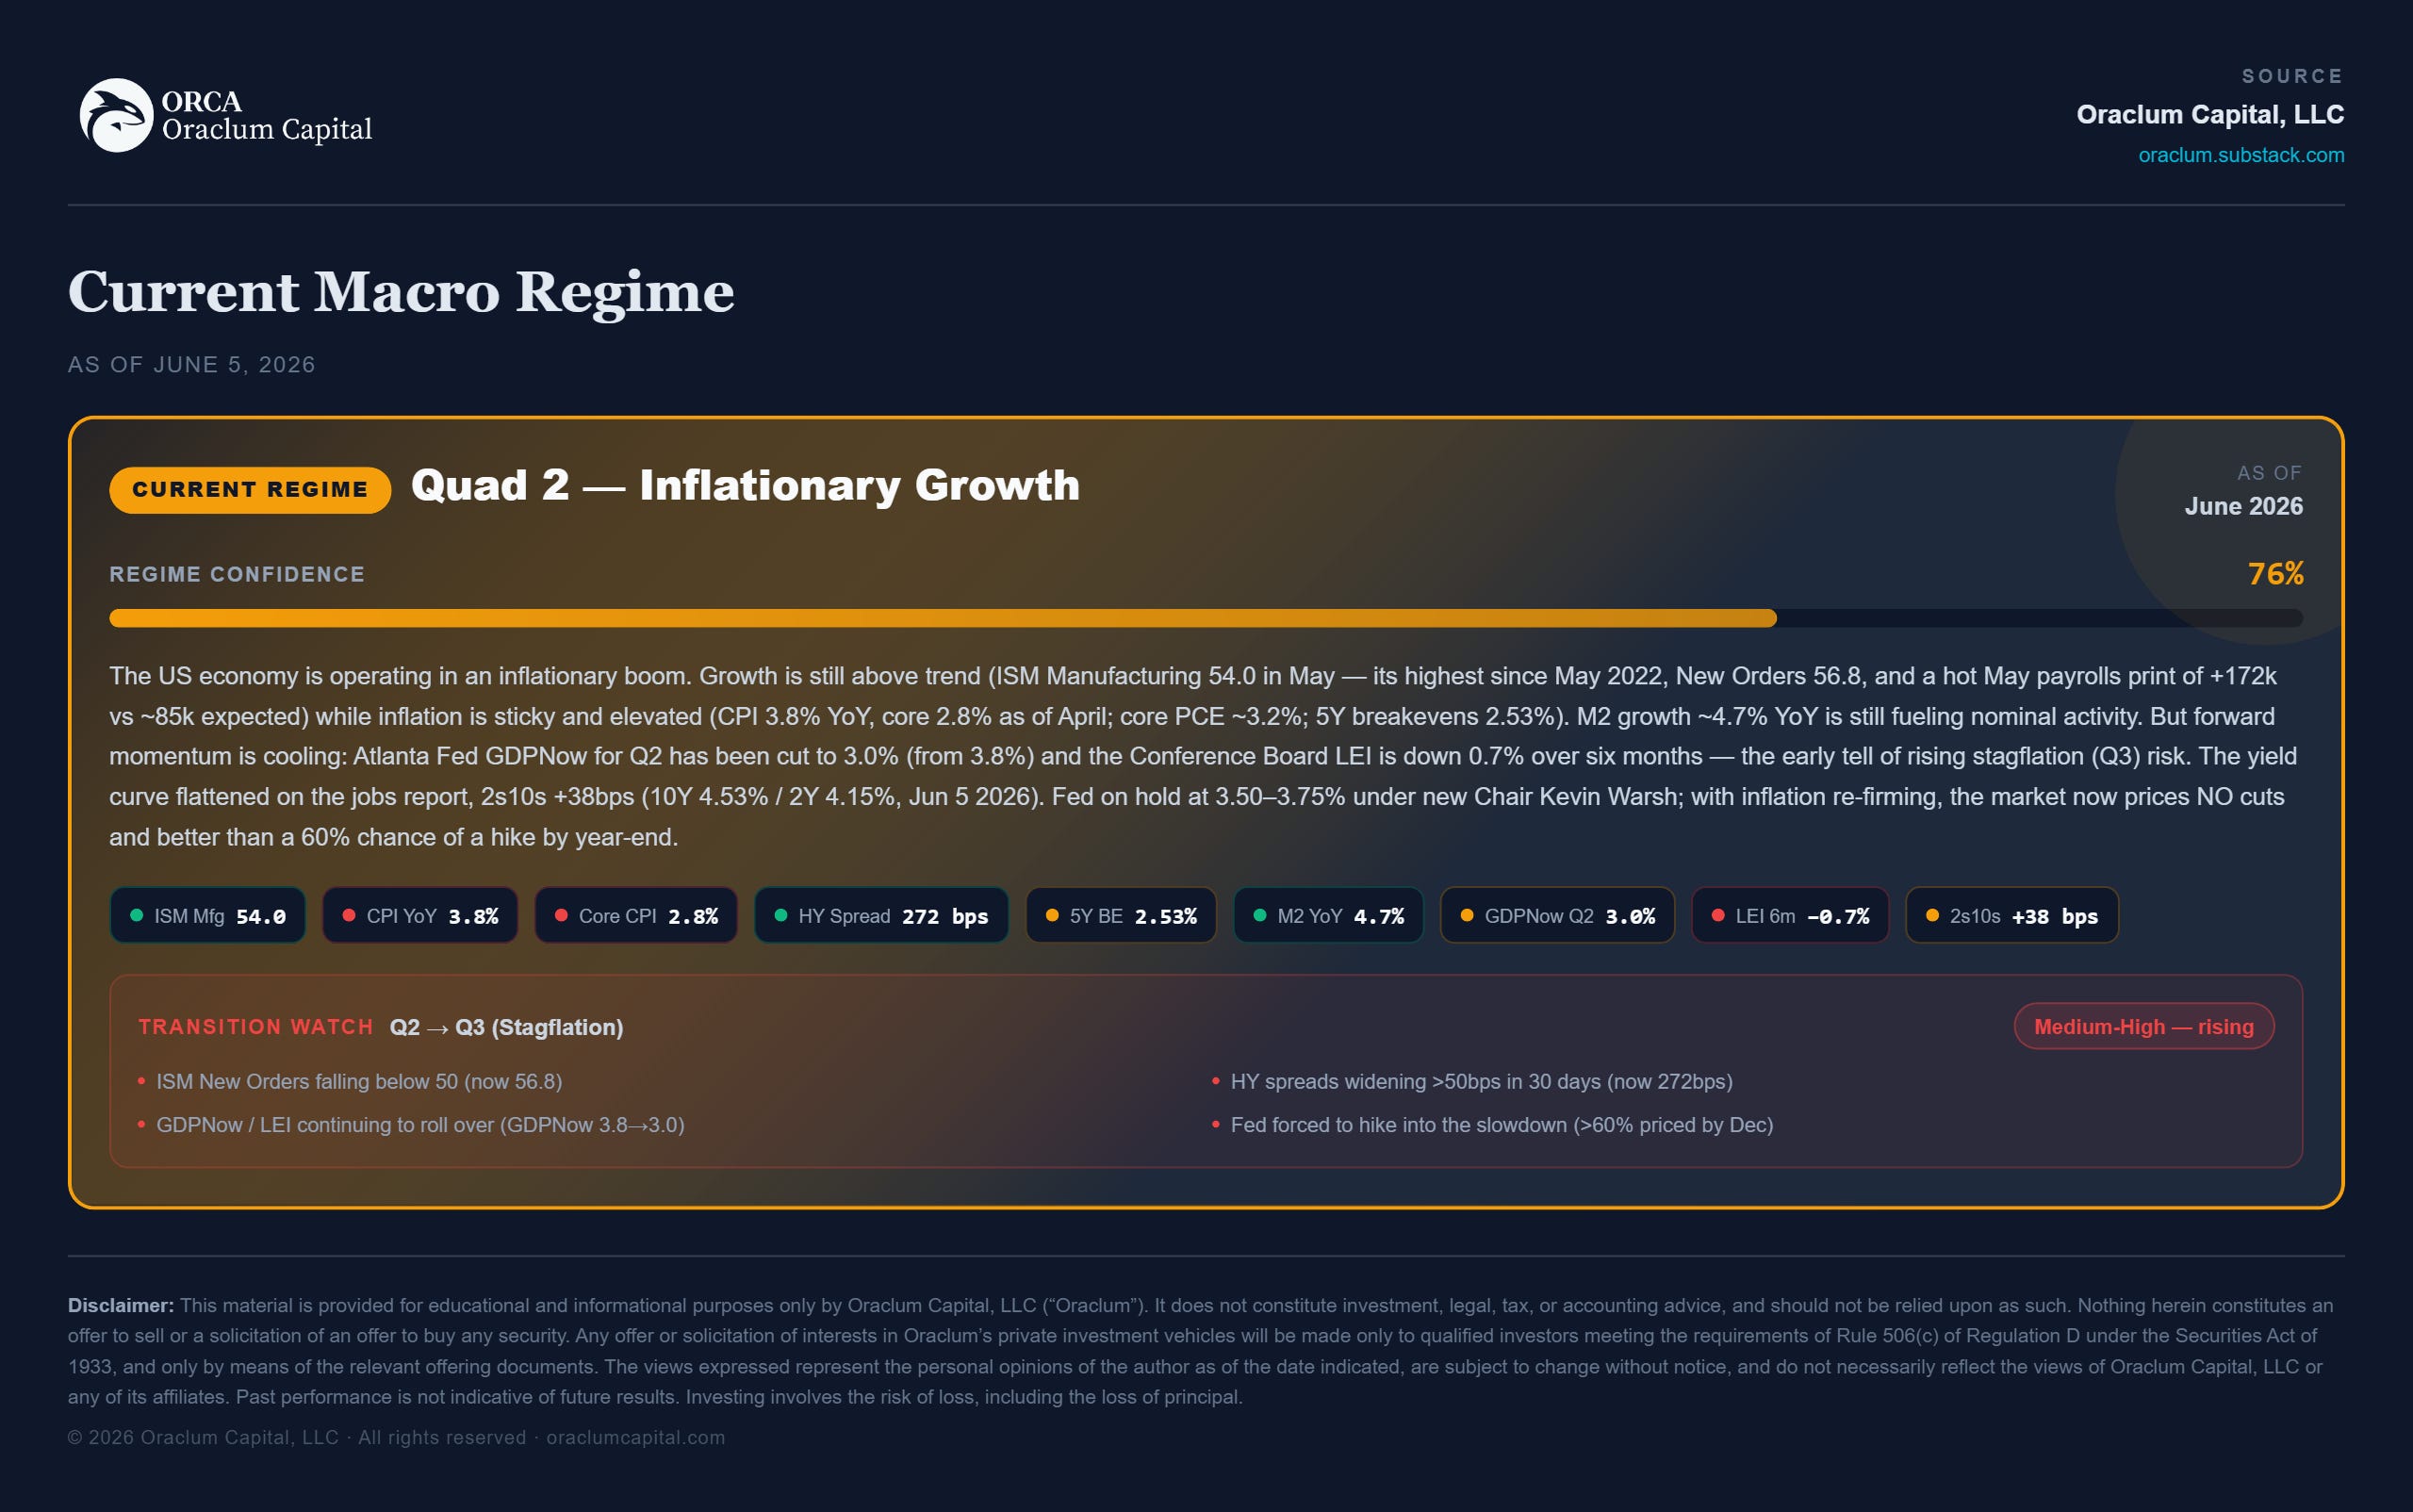
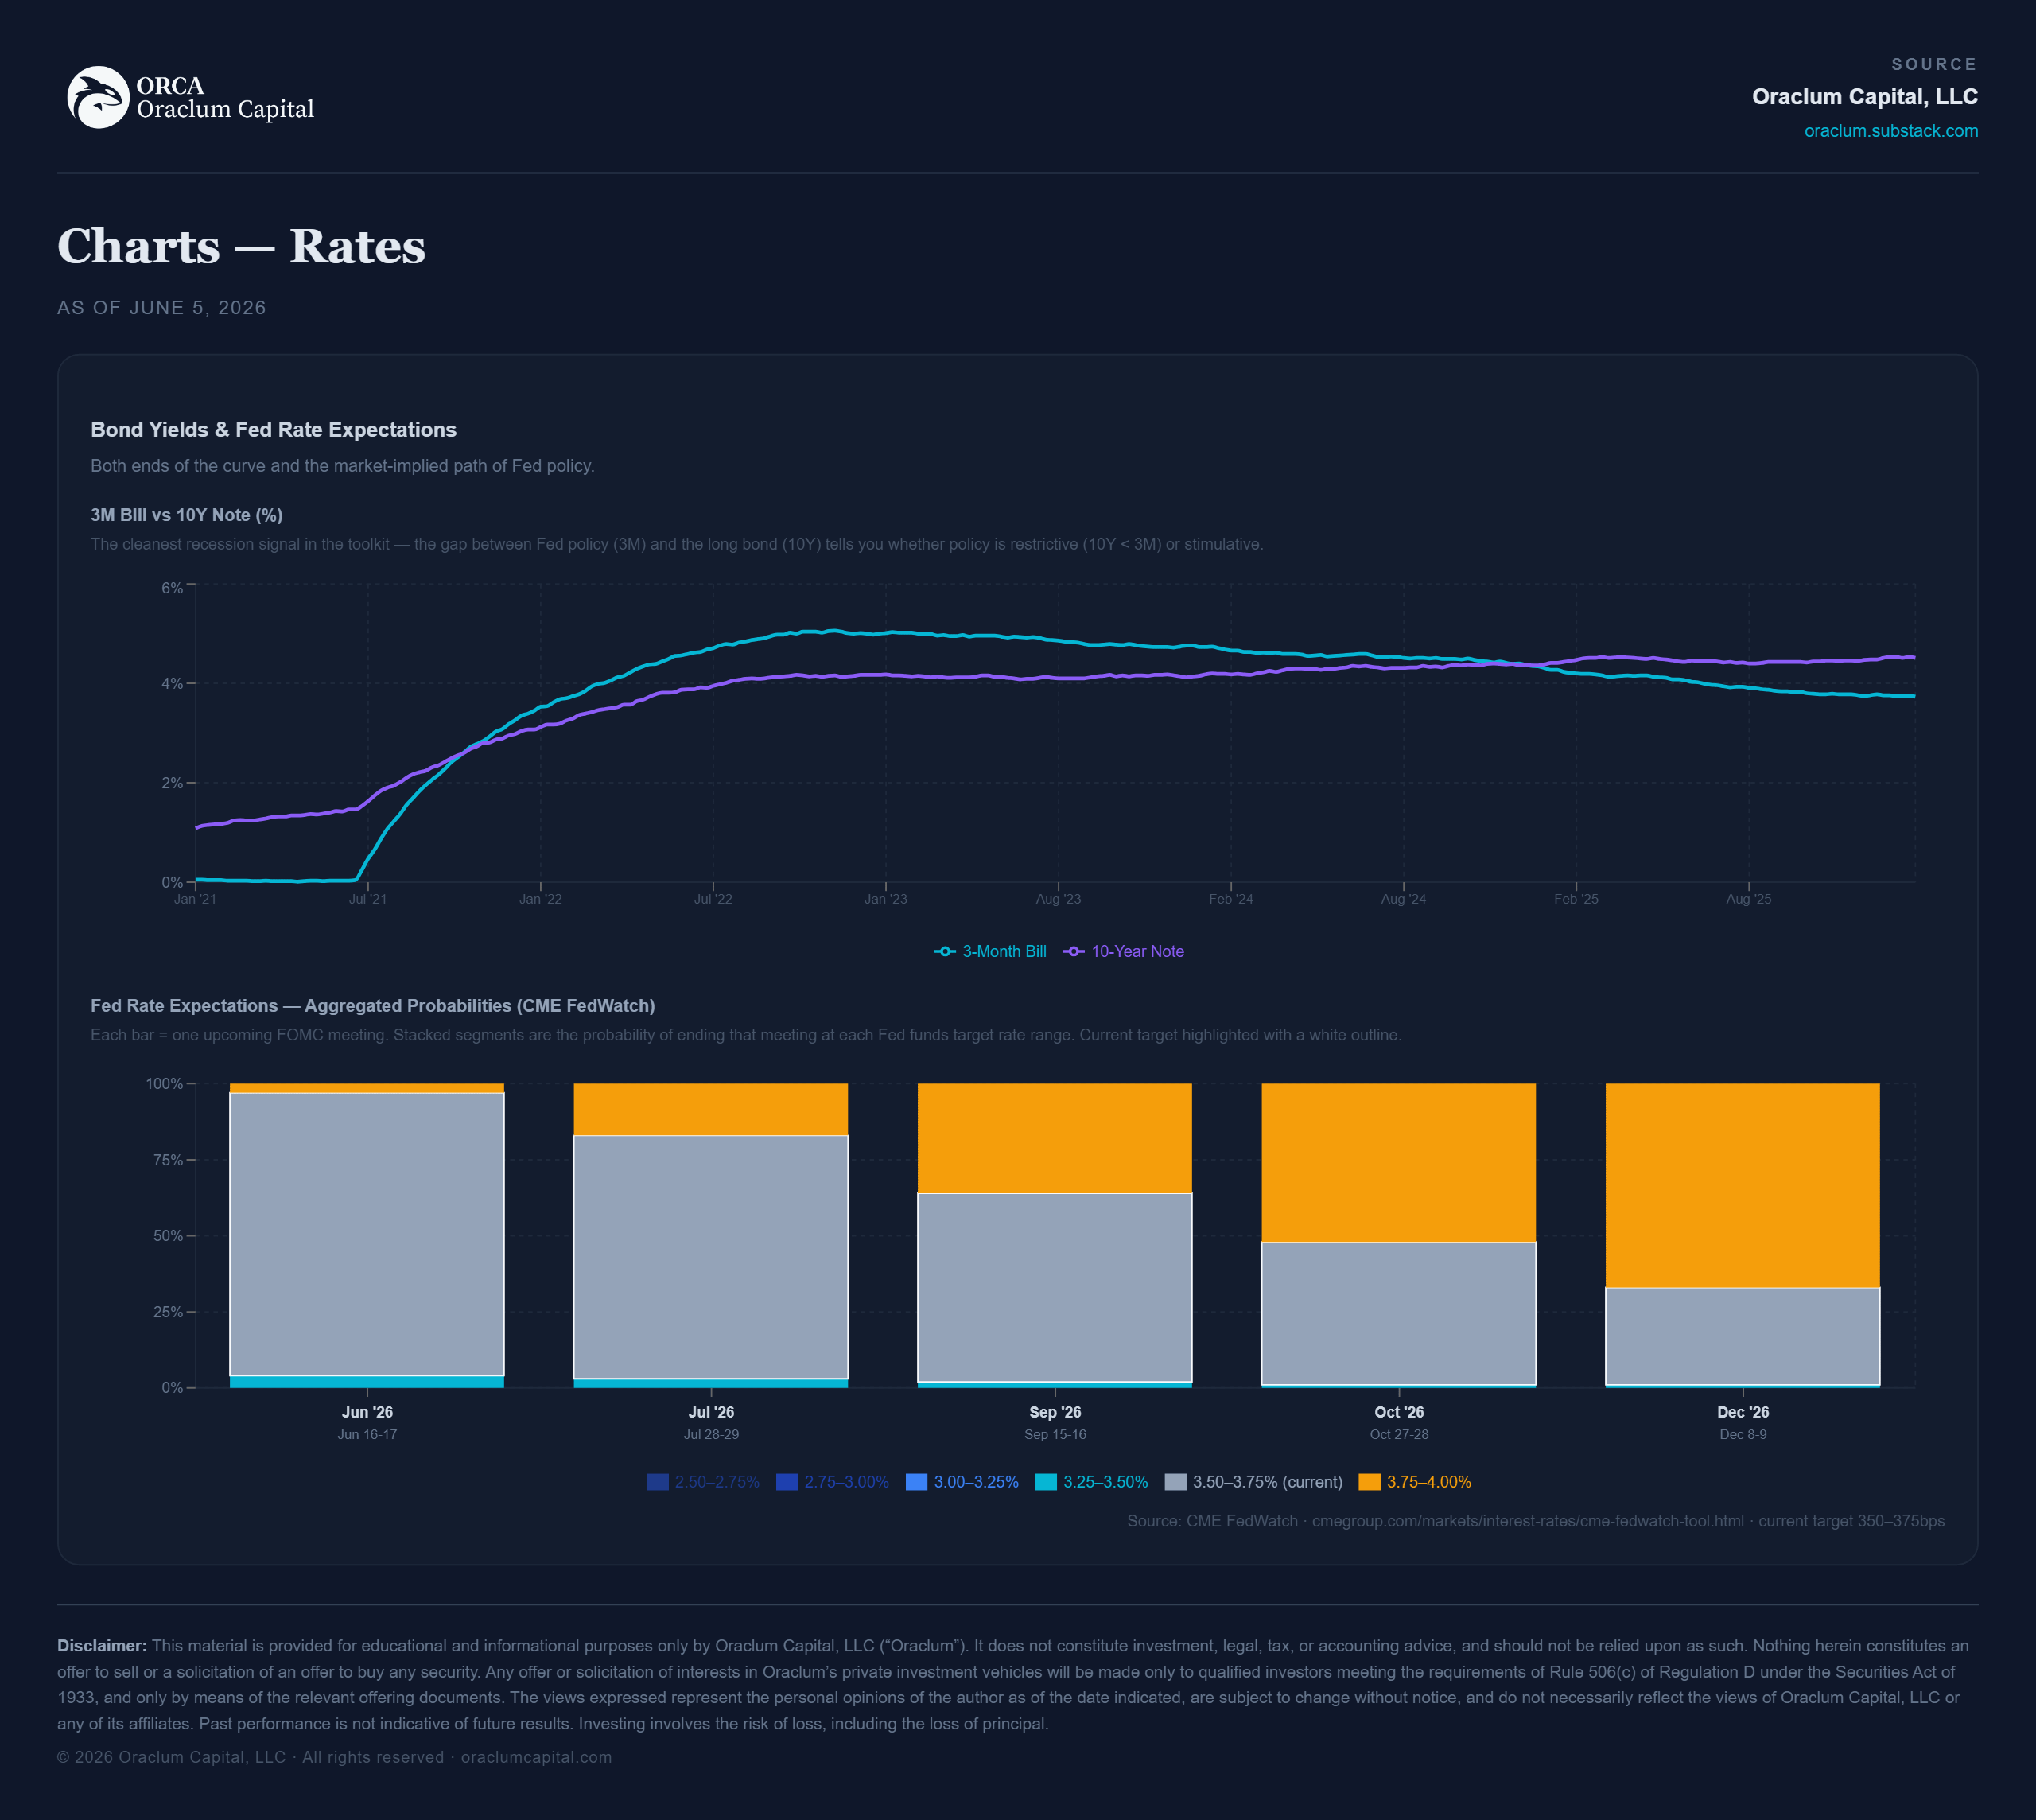
It’s an inflationary boom, which is the part that matters. CPI is 3.8% headline, 2.8% core, and not falling. The economy is running hot on both the growth and the price side at once: Quadrant 2 on the dashboard, the “overheating” regime. And on Friday the market spent the afternoon working out the only question that matters from here: does an inflationary boom cool into a soft landing, or does it tip into stagflation, and we are back to higher for longer? If you look at Fed rate expectations, it certainly seems like it - 3.75% pretty much anchored by year-end, and 4% in 2027. Yikes!
I spoke about the implication of higher for longer at the market open on the floor of the NYSE on Friday for AssetTV. Mind you, this was before the aggressive sell-off of 3% in SPX and 5% in NASDAQ before the end of the day. More about that towards the end of today’s post 👇
▎PRO: this week’s flagship macro read
Normally the Saturday Pro report ($35/mo tier). Free for everyone during the launch window.
The regime, stated plainly
Quad 2, inflationary boom, confidence high. Growth above trend and still accelerating on the manufacturing side; inflation sticky and, on the latest prints, re-firming. The forward multiple is rich at 21x, but earnings are growing fast enough to carry it. The dashboard’s transition arrow points one way: Q2 → Q3, toward stagflation, and the probability on that is medium-high and rising. Not because growth is weak today, but because the things that lead are softening at the edges. Atlanta Fed GDPNow for Q2 has been cut from 3.8% to 3.0%, and the Conference Board LEI is down 0.7% over six months even as the coincident data stays strong.
So the picture is a hot economy with the first hairline cracks in its forward momentum, and an inflation problem that won’t quit. That combination does one specific thing to monetary policy, and that’s what broke on Friday.
Why Friday happened
A hot jobs number in this regime is “good news is bad news,” and the mechanism is simple. The 10-year jumped to 4.53%, the 2-year to 4.15%, and every long-duration asset got repriced in an afternoon.
That is textbook Quad 2 mechanics. In an inflationary boom the assets that suffer are the long-duration ones, long bonds and growth/tech, whose valuations live or die on the discount rate. The assets that work are the real-economy ones: energy, materials, financials, cyclicals. Friday delivered exactly that split. The S&P fell 2.6%, but the average hides the rotation. Tech (XLK) closed −6.7%, semis had their worst day since March 2020. Financials (XLF) closed green, +0.2%. Industrials gave back barely a percent. High-yield credit, HYG, was down half a percent and spreads didn’t gap. Money didn’t leave the market. It left the part of the market the regime says to underweight, and rotated into the part the regime says to own.
The signal library is positioned the same way
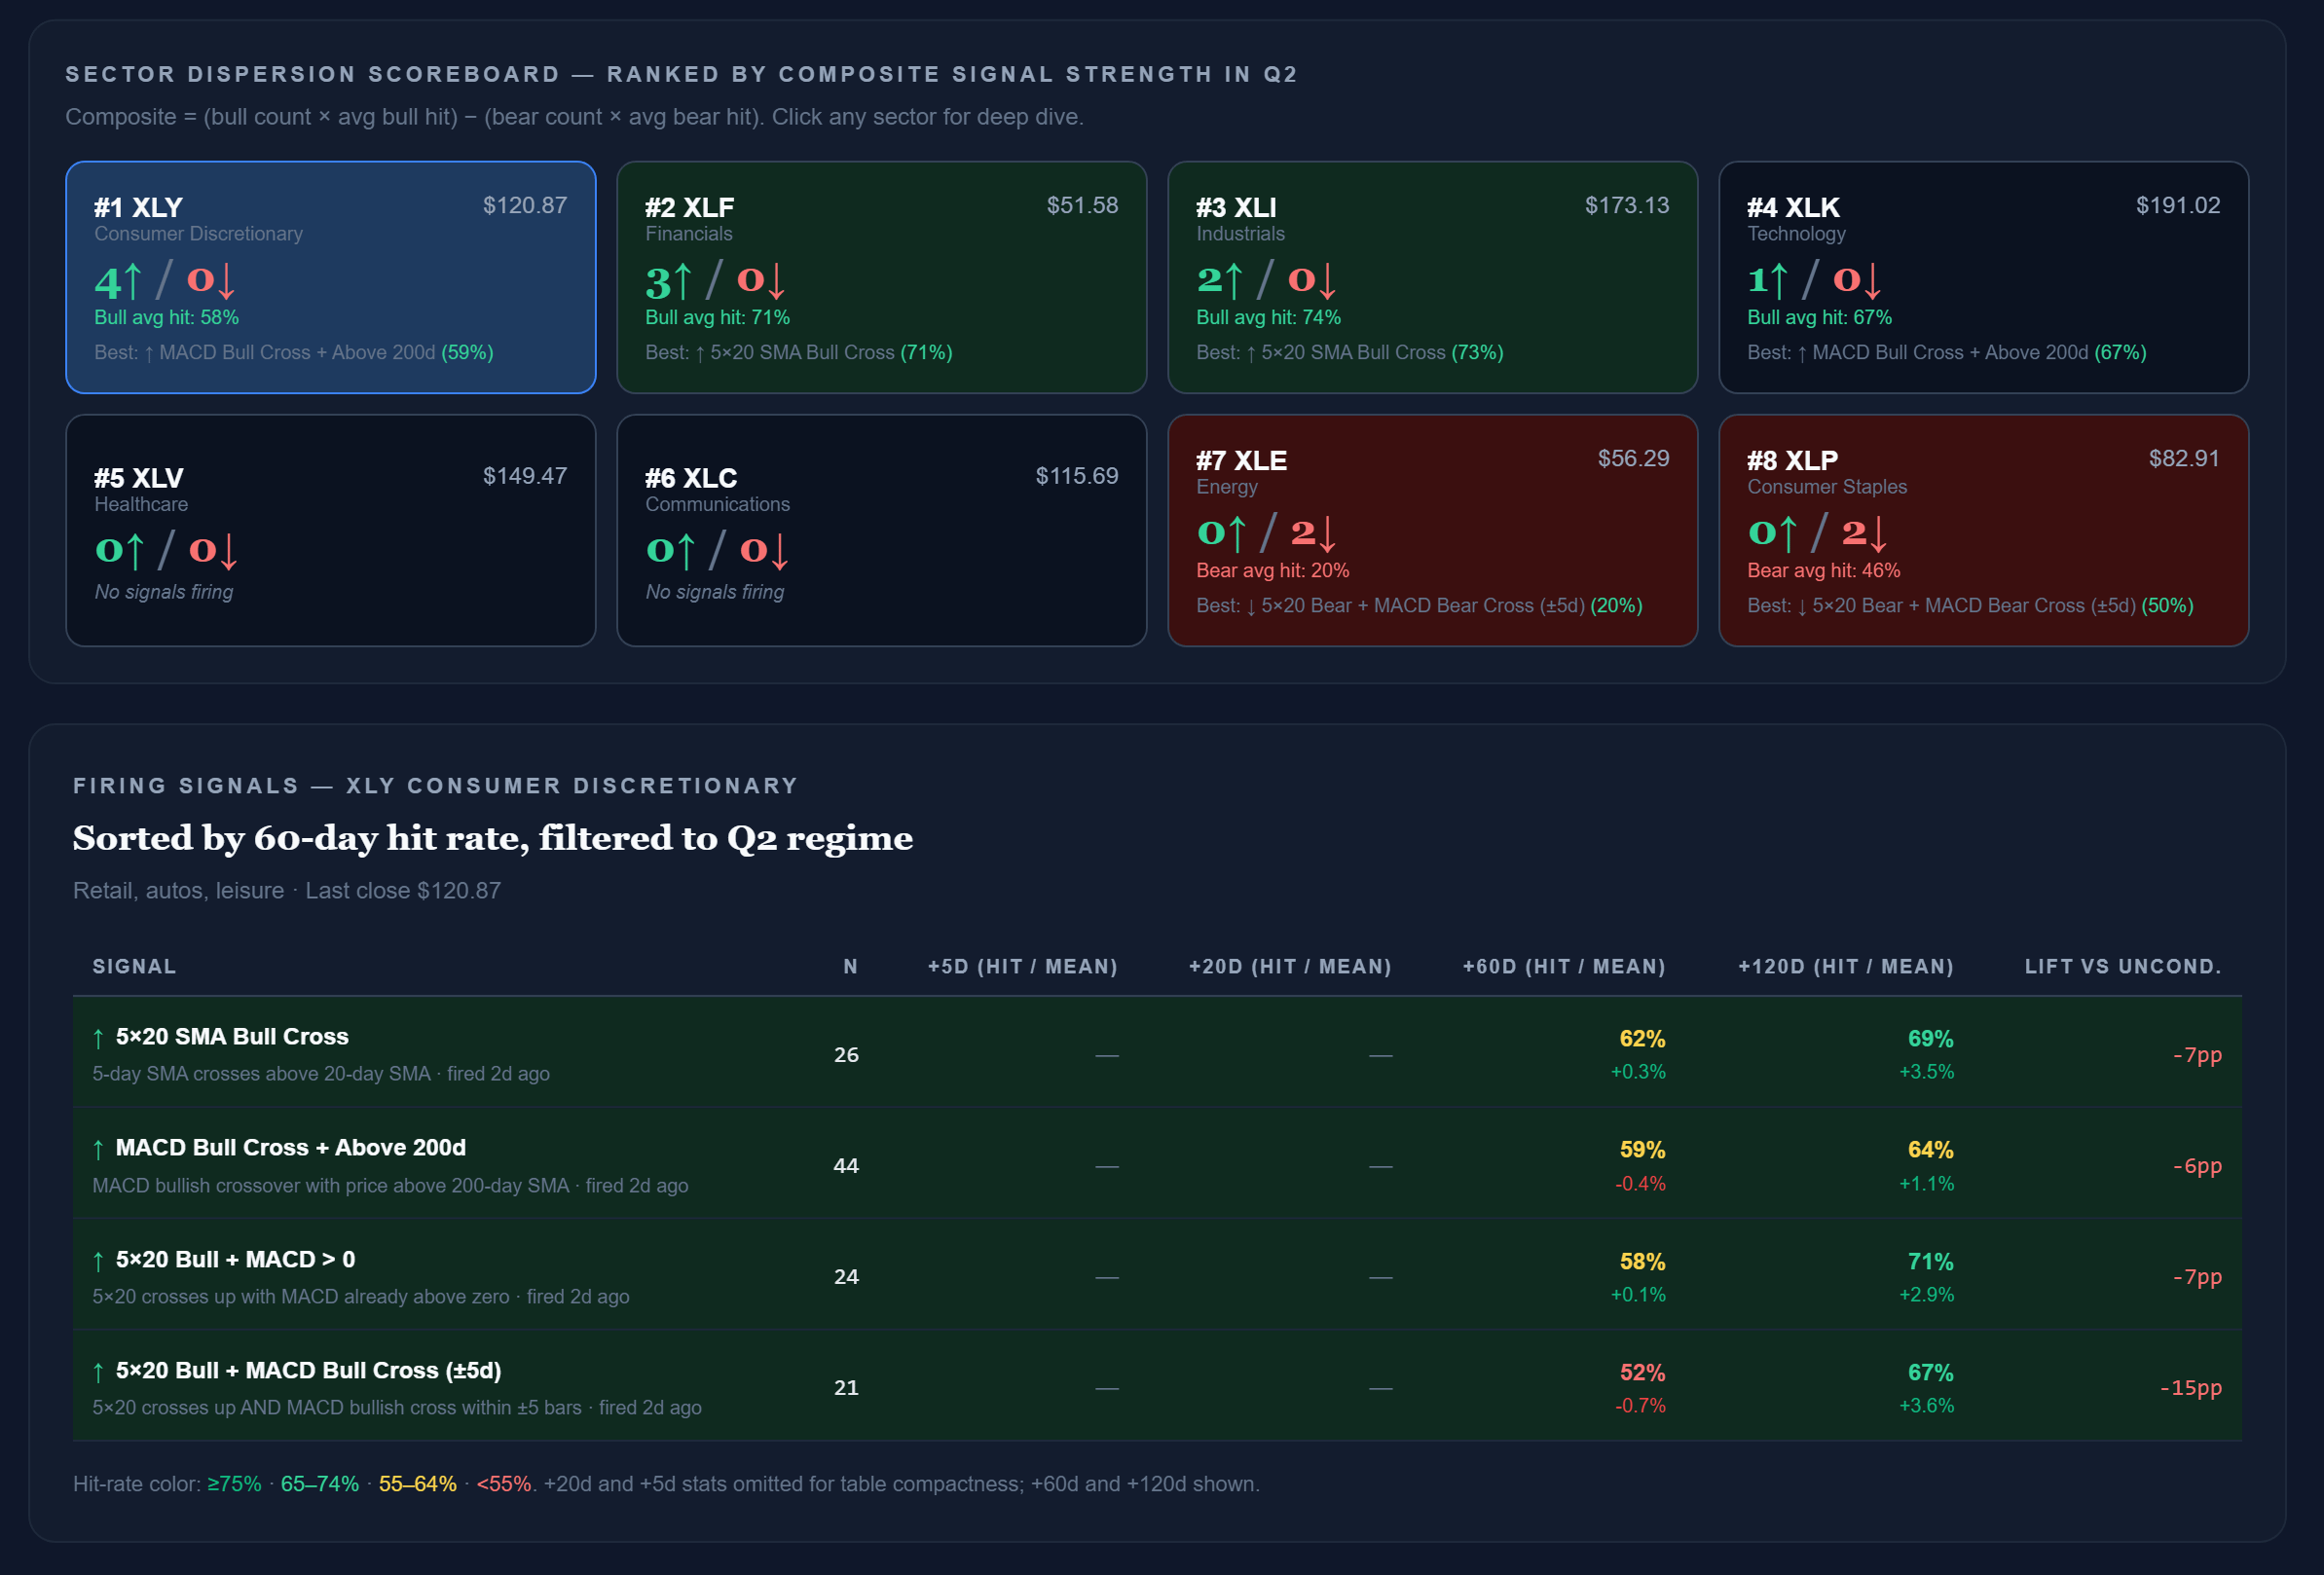
The cleanest setup is now in financials, with four separate XLF signals firing, one of them a MACD-bull-above-the-200-day that triggered on the selloff day itself, at a 71% hit rate over 60 days, +6 points of lift. Industrials sit right behind it (74% hit, +5). Energy is firing too. And the tech and discretionary signals that were live a week ago got knocked clean out by Friday’s tape. The library didn’t get a memo about the regime. It just sorted itself into the inflationary-boom leadership on its own.
The only question that matters: soft landing or stagflation?
An inflationary boom is not a stable state. It resolves one of two ways, and they could not be more different for your book.
Road one => soft landing (Q2 → Q1). Inflation cools without breaking growth (it was “transitory” after all), the Fed gets to stop, and the boom matures into a disinflationary expansion. This is the good ending. It’s 1995, after the Fed hiked through 1994 and then paused into a soft landing. It’s 2023 disinflation. Equities broaden and run.
Road two => stagflation, higher for longer (Q2 → Q3). Inflation stays sticky, the Fed is forced to keep tightening, and the lagged hit finally rolls growth over while prices are still high. This is the worst regime for stocks there is. It’s 2022. It’s 1973. Friday’s hot print, and the hawkish repricing it forced, nudged the odds toward this road, which is precisely why the long-duration end of the market took the pain.
We are not on either road yet. We’re still in the boom, and the leadership is confirming it. But the transition risk is real and rising, and the whole game now is watching which way it breaks.
Pro bottom line
Own what the regime owns: financials, industrials, energy, the cyclical and real-economy leadership that held on Friday and now carries the cleanest signals in the book. Underweight the long-duration end, growth/tech and long bonds, that carries the rate risk. And watch the stagflation tells, because the day the boom tips is the day this stops being a rotation and starts being a problem.
▎PREMIUM — the portfolio layer
Normally Premium only ($120/mo tier) - position sizing, the regime playbook, sector construction, and the bear case on my own call. Also unlocked for the next two months.
The dashboard’s inflationary-boom regime carries a specific asset tilt, drawn from sixty years of history: overweight commodities (energy, metals), TIPS and real assets, and cyclicals - financials, materials, industrials; underweight long-duration bonds, growth/tech, and the dollar. That isn’t a view. It’s the base rate for this regime, and Friday was a clean live demonstration of why it exists.
The episodes that rhyme with where we are, an inflationary boom with a Fed being forced hawkish, bracket the same two roads:
2004–2006 (housing and commodity supercycle): the Fed hiked steadily into a boom, cyclicals and energy led, and it worked for two years before the cycle finally turned in 2007. The lesson: this regime can pay for a long time before it doesn’t.
1994–1995 (the soft-landing template): aggressive hikes, a pause, and a melt-up once the market trusted the landing. The bull road.
2018 (boom into a hawkish Fed): a hot wage print and a vol spike took the legs out in a week, and the year ended with a Q4 washout. The warning that this regime is fragile to exactly the kind of print we got Friday.
2022 (the stagflation road): sticky inflation, a Fed that had to keep going, and the worst year for a balanced book in a generation.
NOTE: I rebuilt the dashboard’s macro layer this week against verified June data, and the engine’s nearest-neighbor analog list is being recomputed against the corrected regime - so I’m citing these episodes from the regime playbook and the macro record rather than the old automated matches, which were anchored to a stale read. When the recompute is done I’ll show you the quantified version.
Portfolio construction
Keep the core tilted to the regime: overweight financials, energy and materials, a real-asset/TIPS sleeve as the inflation hedge, and underweight long-duration Treasuries and the high-multiple growth complex. This is not a hedge against the boom; it’s an expression of it.
Express the tactical edge through the leaders Friday confirmed: financials and industrials, the two with the cleanest, highest-lift signals in the book, with energy as the commodity-beta satellite. Tech stays underweight, not shorted, just underweight, because it’s the part that carries the rate risk and Friday showed you what that costs in a single session. Size the tactical sleeve so that if the regime tips to stagflation and the cyclicals roll, it’s a managed loss against a real-asset-tilted core, not a hole.
The tells: watching for the transition
The leash this week is a stagflation watch, not a contraction watch. In order of weight:
ISM New Orders. 56.8 now, the strongest part of the report. This is the early bend - when it rolls under 50 while CPI stays high, Q3 is arriving.
5Y breakevens. 2.53% and worth watching closely: if inflation expectations un-anchor higher, the Fed’s hand is forced and the stagflation road opens.
GDPNow and the LEI. Already softening (3.8→3.0; −0.7%/6m). Continued deterioration is growth cracking while inflation holds.
HY spreads. 272bp, near the tightest since 2007. The risk-off canary. A gap wider is the market pricing the transition before the macro confirms it.
The Fed actually hiking. Priced at >60% by December. The day it happens, the long-duration repricing from Friday gets a second leg.
The bear case on my own call
Because there always is one, and here it’s sharp. My position, own the cyclicals and ride the boom, is the right trade in Quad 2 and the wrong trade the moment it becomes Quad 3. And the thing that flips it is the very data I’m calling bullish. The hot labor market and sticky inflation that justify owning financials today are the same forces that, pushed one quarter further, force the Fed to over-tighten and break the growth that the cyclicals depend on. In stagflation, financials and industrials don’t lead - nothing does. 2022 is not a distant hypothetical; it’s the most recent instance of exactly this regime resolving the wrong way.
So I hold the cyclical tilt with conviction but not blindness. The core is real-asset-heavy precisely so the book survives the stagflation path, and the tactical sleeve is leashed to the five tells above. If two of them turn together, the trade comes off - fast.
Premium bottom line
We’re in an inflationary boom, full stop. The data is unambiguous and the leadership confirms it. The open question is the exit: soft landing into a broadening bull, or stagflation into the worst regime there is. Friday’s hot print pushed the odds a notch toward the bad road and repriced everything long-duration, but the cyclical-and-real-asset leadership held, which means we’re still in the boom and still get paid to own it. Financials, industrials, energy, a real-asset core - and I watch ISM New Orders and breakevens like a hawk for the day the regime tips.
Next week: the cross-asset confluence read - whether the dollar, gold and breakevens are confirming the inflationary-boom leadership or already starting to price the stagflation exit. After Friday’s move, that’s the chart I most want to see.
After a red Friday: does Monday continue the selloff?
Finally, after a red Friday like this, can we really expect a negative Monday?
Data says not really.
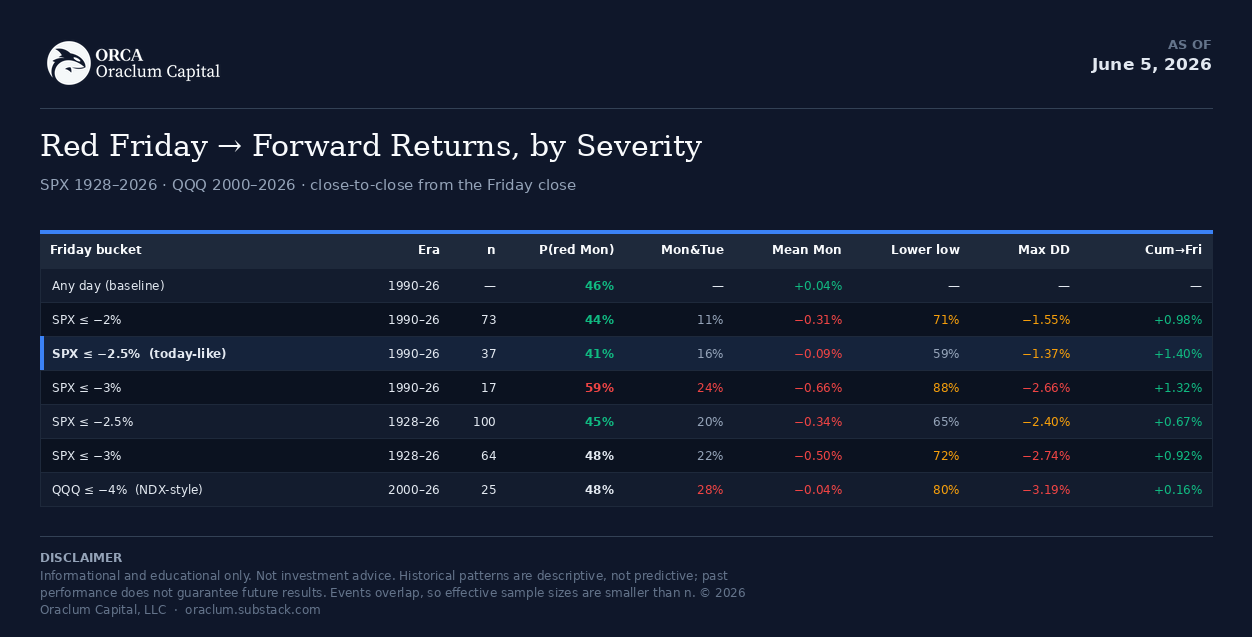
A red Friday is not a strong Monday-continuation signal. Monday is close to a coin flip. At today's magnitude, there is a 45-48% chance of a red Monday, essentially the same as any random day (~46%). The modal path over the following week is a choppy bounce (mean≈+1.2% by the next Friday), but we could get at least one lower low intraweek (~70% of the time) before any recovery. The continuation risk only becomes real when the Friday drop is ≥3%, where red-Monday odds jump to 50–59% and the first two to three days lean lower before mean-reverting:
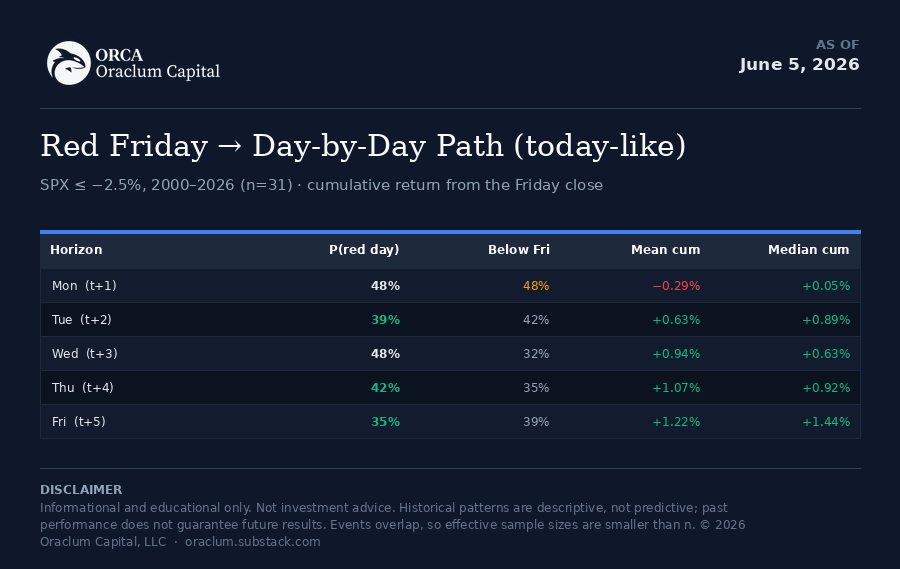
Monday is a basically a coin flip with a small down tilt (mean -0.29%, but median already +0.05% - the average is dragged by a few big continuation days). By Tuesday the bounce takes over (Turnaround Tuesday everybody!): median cumulative turns clearly positive and stays there. The probability of being below Friday’s close drops from 48% (Mon) to 32-39% by midweek.
Obviously, this does NOT mean this is how it will play out next week. I’m just giving you the probabilities.
What is interesting to call out is the following:
The fear is overpriced at this magnitude. A -2.6% Friday does not raise Monday continuation odds above a normal day. If anything they’re slightly lower. The crowd that sells Friday’s close expecting a Monday gap-down is, historically, fading a coin flip.
But expect a retest first. 68–80% of these episodes print a lower low at some point in the next week, average max drawdown -1.5% to -3%. The week ends green on average, but rarely in a straight line. Plan for a violent, two-sided week, not a clean V.
=> Oh yeah, did you hedge when we talked about it? Pushing into all time highs is always a good idea to think about protecting all those unrealized profits. It might be late to buy new hedges now, so maybe wait for a bounce.
Severity is the real signal, not the day of week. The continuation edge is monotonic in the size of the drop:
−2% → mean-revert;
−3%+ → genuine Monday/Tuesday follow-through (red-Monday 48–59%, two-day continuation 22–28%).
Today’s −2.6% SPX is in the benign middle bucket - but the −4.8% QQQ is in the steeper, choppier NDX cohort (median cumulative actually negative on Tue and the following Fri), which argues the tech side stays messier than the index for the week.This is unconditional. It ignores the regime, the catalyst (Friday was a hot-jobs / hawkish-Fed rates shock, not a growth scare), and positioning. A rates-driven selloff with credit and breadth intact - which is what we have - historically mean-reverts faster than a credit-led one. So if anything the base-rate bounce bias is reinforced this time, with the caveat that another hot inflation print restarts the clock.
Thanks for reading! And thanks for subscribing to the newsletter.
Don’t forget to tell your friends.
Or as the YouTube generation says Like, Share, Subscribe:
DISCLAIMER: Neither the survey nor any of the contents of this website can act as investment advice of any kind. The results of the survey need not correspond to actual market preferences or trends, so they should be interpreted with caution. Oraclum Capital, LLC (Henceforth ORCA) is a management company responsible for running the ORCA BASON Fund, LP, and for organizing a survey competition each week, where it invites the subscribers to its newsletter (this website) to participate in an ongoing prediction competition. The information presented on this website and through the survey competition should under no circumstances be used to solicit any investment advice, nor is it allowed to be of commercial use to any of its readers. The survey and this website contain no information that a user may use as financial or investment advice. All rights reserved. Oraclum Capital LLC.