


The week was underwhelming. Gradual grind up with continued vol compression. Markets pushed into new all time highs (touching 6,600 on SPX briefly on Friday) and still no correction in sight.
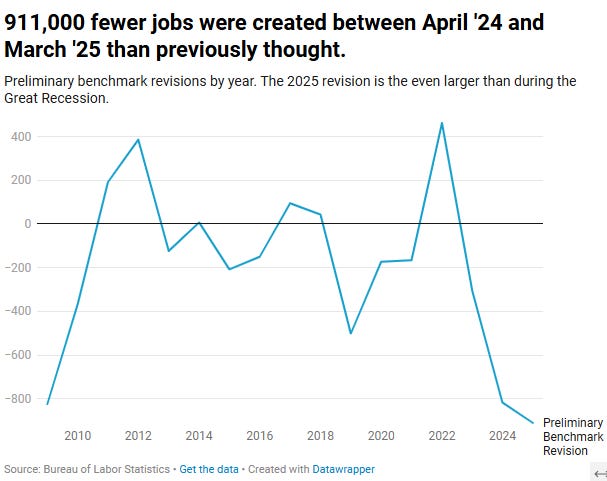
The most important pieces of data were (1) the BLS revised estimates on jobs growth - turns out the previous estimates were off by 911,000 jobs (!), which suggests that the labor market was much weaker than previously believed. That’s bad news for the economy, as it suggests a stagflationary environment, even though GDP growth and earnings are still riding pretty high. We could potentially be experiencing a productivity-driven (AI?) decline in labor demand but that’s a topic for another discussion. The trend is certainly concerning, and it increased the probability of Fed cuts - markets are now pricing in 3 cuts before the end of the year (rates down to 3.5%).
And (2); PPI and CPI inflation came in lower than expected for the former (negative month-to-month and 2.6% vs 3.3% expected Y-o-Y) and in line with expectations for the latter (2.9%). The PPI surprise was interesting especially compared to its values only a month ago when a high reading was a clear sign that producers are eating the costs of tariffs. Some of it, however, is clearly translating to the end consumer, as CPI inflation remains above target. And the Fed is expected to cut 3 times this year while growth is still strong, inflation is still above 2%, but the labor market is undoubtedly weaker. Next week I’ll dig deeper into this conundrum.
We said last Saturday that we expect the next two weeks to be either sideways or grinding up and that this will likely set us up for a strong push into end of year starting early October. And that the danger lies in and around OpEx.
Shorting after OpEx?
However, before we get there, we still have a few things to track. First, a bit of interesting statistics coming into the major quarterly OpEx.
We ran some numbers for September over the past 25 years, and here’s what we found:
Over the past 25 years, during the second and third week of September, SPX on average stays up, just as it hits quarterly OpEx in W3 (week 3). But then, after OpEx we get a decline into W4 (final week of September), which gets extended down (or remains flat) into the first week of October.
The table below summarizes the most important info:
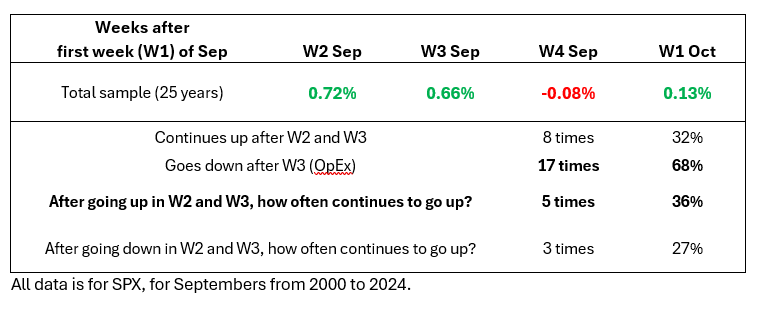
If you think the moves are small, they’re not. The numbers reported in the first row are when all is averaged out (so winners and losers pooled together). In many cases the drop after W3 can be significant (3-4% on average). That’s the September correction basically.
But only if it drops. Hence the statistics reported below. In 8 years out of 25 years (32% of the time), SPX continued to go up after OpEx week (into W4 and W1 of October). However, only 5 of those years (out of 14 in total when SPX opened Sep higher), it continued to go up after moving higher in W2 and W3. This is where we are currently, SPX is likely to be up during W2 and W3, and hence the question is will it continue.
To sum up:
68% of the time (17 out of 25 years), SPX went down after OpEx week in September.
64% of the time (9 out of 14 years), SPX went down after OpEx week when the SPX made up moves in the two weeks before, coming up to OpEx.
Therefore, we can say that around 2/3 of the time, September OpEx was the signal to go short the market in September.
Does this mean we’ll get the same thing this year? Of course not!
It just means that the probability of that happening is higher.