

Oil broke up. Again 🙄

Three weeks ago I wrote that the whole market was watching which way the barrel breaks. This was to tell us what would happen with inflation and how the Fed might react. This week oil broke up. Again.
The peace framework that dragged oil down from 90-100 to the high 60s fell apart this week. Tankers were hit in the Strait of Hormuz, the US answered with strikes on Iran, and the export exemptions are gone. WTI went from under $69 to almost $75 in two days, and settled Friday at $71.50, up 4.5% on the week.
Here is the part I care about more than the headlines. The day the ceasefire died, the signal library fired its rarest setup: a MACD bull cross on oil landing on a freshly reset RSI. Under the full set of filters I run (regime match, weekly trend agreement, VIX under 25) this has fired only nine times in the historical data. Eight of those nine saw oil higher 60 trading days later, with an average move of +12.7%. No other signal in the book comes close to that hit rate. It is a small sample, sure, but when a nine-observation signal has one loss in it, I pay attention.
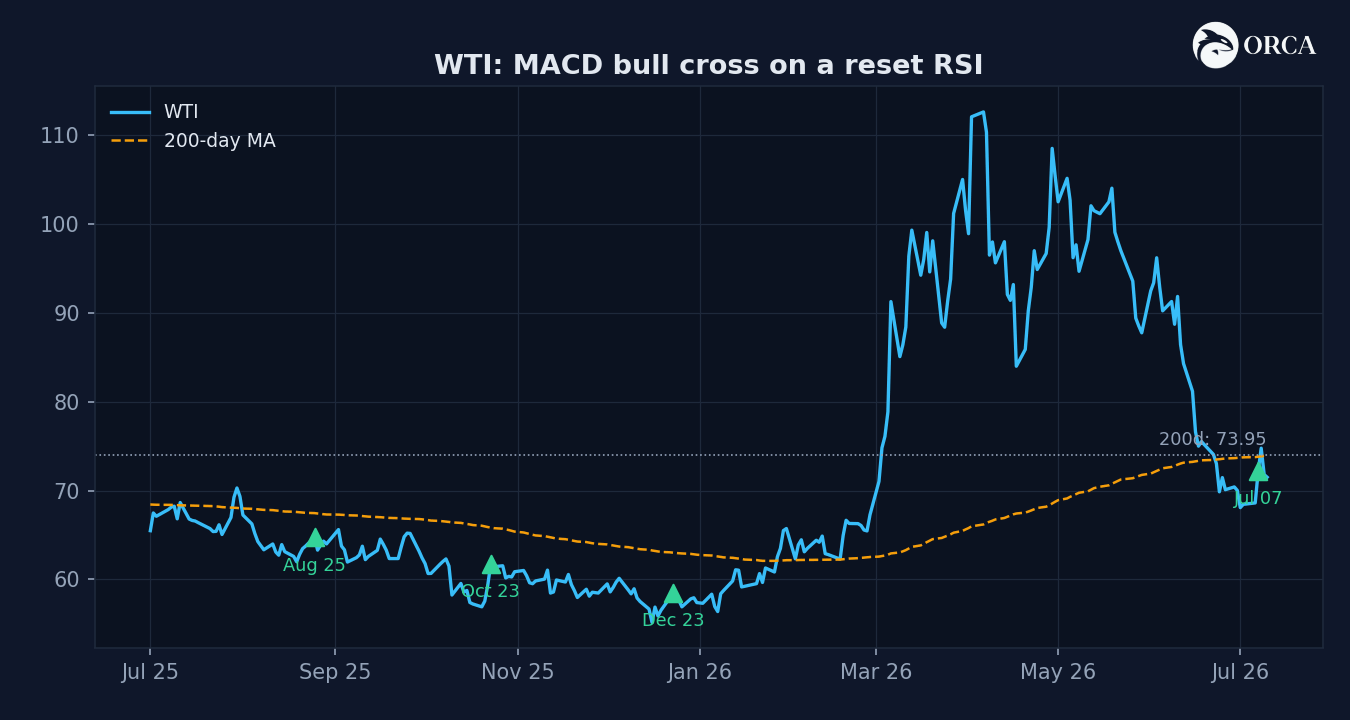
The level to watch is the 200-day average at $73.95. We poked above it on Wednesday and faded back under. A weekly close above that line converts a geopolitical headline into an inflation input, two weeks before a Fed meeting that is already flirting with a hike. Not the ideal set-up.
The bond market wasted no time
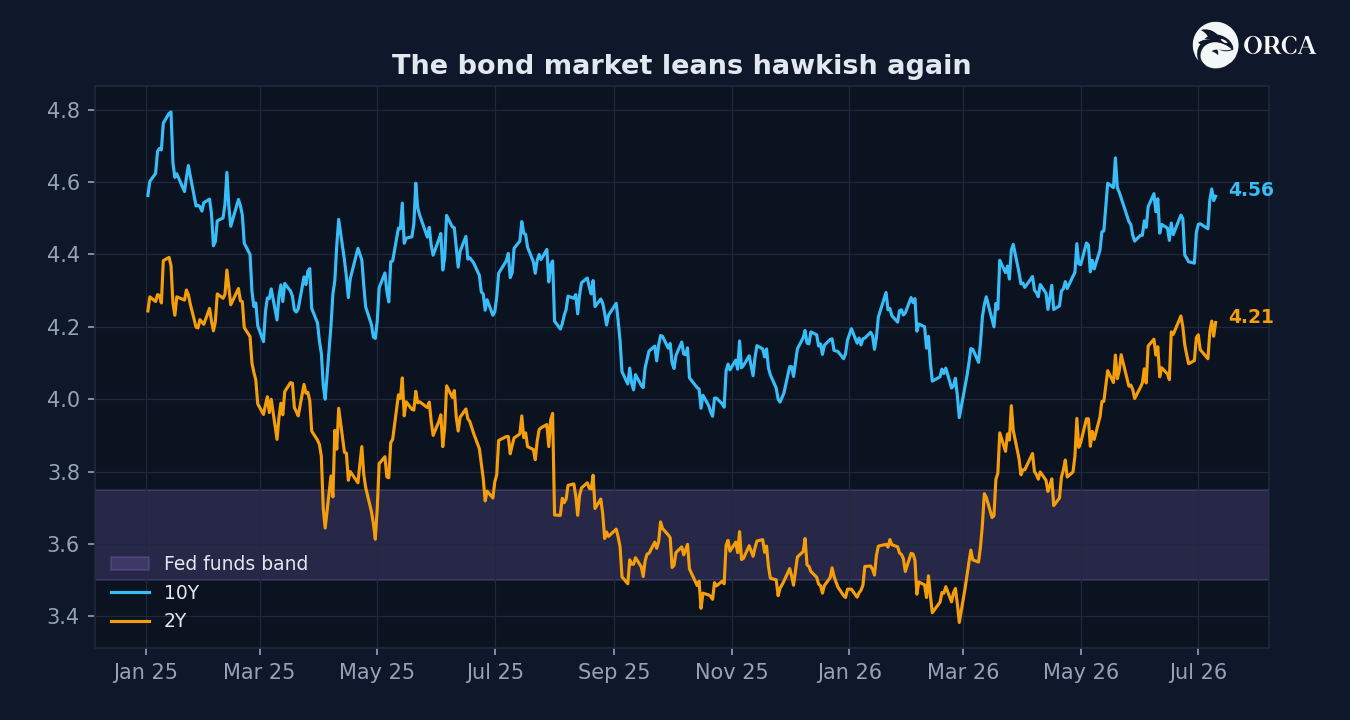
You’ll recall from the FOMC rulebook post that with Warsh killing forward guidance, the bond market prices the path itself now - and the 2Y yield is the one telling the Fed what to do.
So what is it saying? The 2Y climbed to 4.21%, further above the 3.50-3.75% funds band. The 10Y went from 4.38% to 4.56% in nine sessions, a parallel shift that kept the curve at +35bp. TLT lost its 200-day average along the way. Futures now price roughly 30% odds of a hike on July 29 and about two-thirds odds of a hike by December.
Read that again: the front end firmed up its hawkish lean before seeing a single new inflation number. That’s the bond market doing its job - it saw the barrel turn and repriced the CPI path on the spot. Also, not the ideal set-up into the July FOMC.
Next Tuesday is the whole week
June CPI lands on Tuesday, July 14th at 8:30am, with Warsh testifying before Congress the same morning and the big banks opening earnings season an hour later.
Now the wrinkle most people will miss. June was the month oil fell - from $92 on the 1st to $70 on the 30th, as the peace framework was being priced in. So Tuesday’s print captures the friendliest energy month of the year, and there is a decent chance it comes in soft. May was the rearview mirror, and now June is too. The print will describe a barrel that no longer exists.
That sets up a trap in both directions. A soft print takes the July hike odds apart and the tape rips - but the July CPI, the one that lands right before the September meeting, will be carrying this week’s spike. A hot print with oil already back above $70 takes July 29 toward a coin flip, and the equity market, sitting half a percent from its record on a 15 VIX, has priced exactly none of that.
Of course, a quick resolution of the geopolitical situation and a move of oil back to mid-60ies nullifies all these concerns, but it’s getting a bit tiring watching this never-ending exchange.
The tape flipped back, hard
Two weeks ago the tape rotated to defense - health care and staples firing buy signals while tech rolled over. I said then it didn’t look like a macro shift yet, and this week the market agreed. The whole defensive rotation reversed.
Health care beat the index by almost 12 points over the prior month. This week it lagged by 3. Energy and tech, the two biggest laggards of that same stretch, are now the week’s leaders. That’s a full leadership flip inside five sessions.
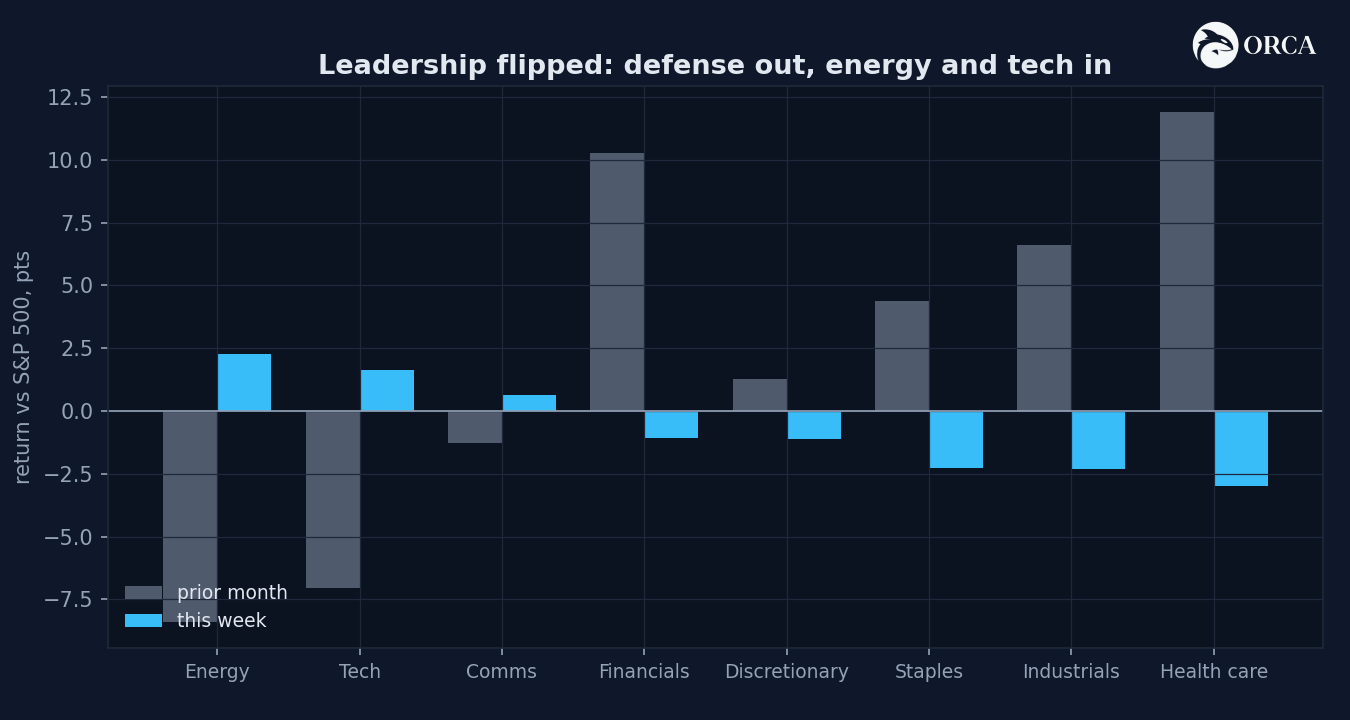
The signal library sorted itself the same way. The Technical and Rotation watch in the Dashboard (regime Quad 2, weekly alignment, VIX under 25) now shows 13 signals firing, and the composition is the story: the oil signal above, a fresh 5×20 bull cross on tech (74% hit rate over 60 days), the S&P’s own MACD bull cross above the 200-day (71% across 65 occurrences), communications at 78% on a small sample - and a full cluster of four bull crosses on the 10Y yield itself, which is the library agreeing with the bond market that yields go higher. The health care and staples cluster that led the scan for two straight weeks? Gone. All of it.
Energy’s own ETF crosses fired too, though their historical edge is weak, so I treat them as confirmation of the oil signal rather than a trade on their own.
Meanwhile, equities partied like the bond market doesn’t exist
The S&P closed at 7,575, up 1.2% on the week, second weekly gain in a row, half a percent from the June record, +10.5% on the year, and 8.8% above its 200-day average. The VIX got crushed to 15.0 - through a week with US airstrikes on Iran in it.
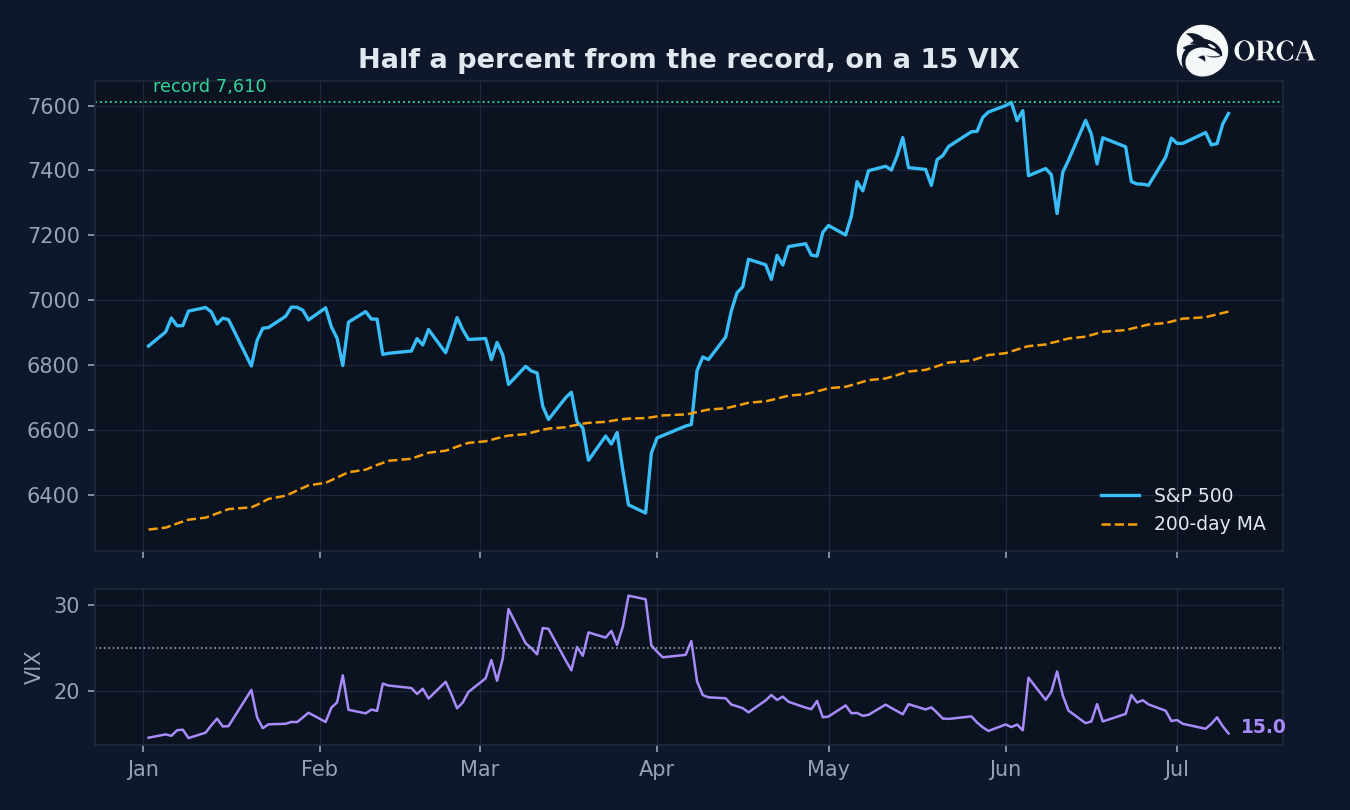
So the bond market spent the week pricing a hotter Fed path, and the equity market spent it buying the dip in tech and closing vol at the lows. These two are describing different Tuesdays. One of them gets to be right, and we find out at 8:31am on July 14th. As mentioned before, the higher probability is on a lighter CPI for June - the rearview mirror of the past month as oil prices kept declining.
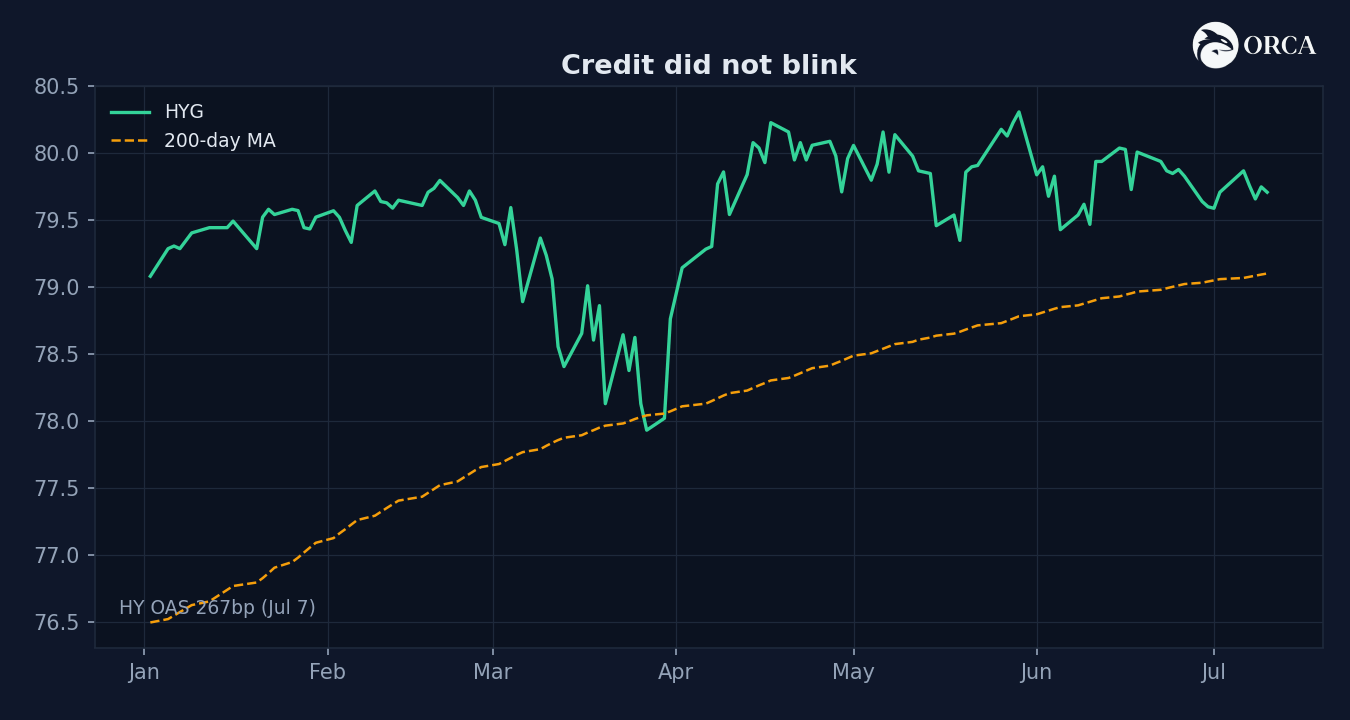
And credit? Credit did what credit has done all summer - nothing. HYG closed the week exactly where it opened it, high-yield spreads at 267bp, four basis points off the tights, through the whole headline cycle. Calm credit into a hawkish repricing is the market telling you it doesn’t believe the hawkish path binds. That was the cleanest confirmation of the bull case three weeks ago, and it still is. Its failure remains the cleanest warning. In other words, there is still no room for macro-level panic. Not even close.
What history says about this exact setup
I re-ran the Dashboard’s analog engine this week against the refreshed feature vector - eleven macro and market features, matched against 36 years of monthly history. The nearest neighbors split the same way everything else does right now.
The friendly matches are late 1996, mid-2004 and mid-1995: mid-cycle booms with a Fed tightening or pausing, where equities paid for another year or more. The regime base rate agrees - in an inflationary boom the index has averaged +2.8% over three months with a 77% hit rate, the best of any quadrant on the dashboard.
The unfriendly matches are the ones I keep staring at. The single closest analog by similarity is March 2021 - the month the reflation trade peaked and buying it stopped paying, even though the economy boomed for another year. And sitting in the top eight are early 2000 and January 2007. Both looked like booms until the quarter after.
Same message as the tape: the base rate says stay long, the tails say know exactly where your exits are. Slow summer grind. As Cem Karsan calls it, the Summer of George!
The position
Own what the regime and the signals agree on: the reflation leadership - energy and the oil signal, index momentum, tech - for as long as the barrel and credit cooperate. Keep duration light until TLT retakes its 200-day; four live bull signals on the 10Y say that’s not yet. And with the VIX at 15 into a binary Tuesday, index protection is the cheapest it has been in a month. I rarely say this, but this is the week to own some.
PREMIUM: the watch list
Ordered by weight. The first two move first.
1. Tuesday’s CPI, and the line in the sand. A 4-handle on headline with core at 3% or above makes July 29 a live decision and forces equities to price what the bond market already has. Core at 2.8% or below and the whole nine-session yield backup unwinds by Thursday. Draft your orders for both branches now, not at 8:31 on Tuesday.
2. WTI against $73.95. The 89% signal says higher over 60 days; the fade from Wednesday’s high says the war premium is still being argued about. A weekly close above the 200-day puts the supply shock into the July CPI print and the September meeting. Below $70, the oil leg of the hawkish case quietly dies and the soft-landing road reopens. This is the master variable, same as it was in June - just pointing the other way now.
3. The 10Y at 4.60-4.65%. Four bull crosses on the 10Y are live. Through 4.65% and the equity multiple gets re-litigated - at 8.8% above the 200-day and a 20.4x forward P/E (five-year average is 19.9x), that argument gets expensive fast. If TLT retakes its 200-day instead, the duration underweight comes off.
4. Breadth, and two coin flips resolving as we speak. 10 of the 13 ETFs I track are above their 200-day. Discretionary closed Friday sitting exactly on the line - to the penny, 117.24 on a 117.24 average, which I don’t think I’ve ever seen before. Communications sits just under its own with a fresh bull cross. Both resolving higher takes breadth to 92% and confirms the flip. Both failing while the index makes new highs is the narrow-leadership pattern that showed up in the 2021 and 2007 analogs, and I’ll flag it the week it happens.
5. High-yield spreads at 267bp. The calmest series on the board, and the one that outranks everything else the day it moves. First weekly close above 280bp and the market is pricing the regime transition before the macro confirms it. Above 300bp the whole call is wrong and the book goes defensive without waiting for a committee meeting.
The bear case on my own call
Every leg of the bullish read is already priced. The index is extended, the multiple is above its five-year average, vol is at the lows into a binary print, and my closest historical analog is the month the reflation trade topped. Add bank earnings guiding soft on net interest income right as yields backed up, and a perfectly ordinary 0.4% core print takes 3-4% off the index in a week. The signal edges are real over 60 days, but none of them know what Tuesday holds. Size accordingly - the oil sleeve sized so a ceasefire-repair headline that gaps WTI back to $65 is an annoyance, not an event.
The calendar does the scheduling from here
GDPNow refresh July 16, LEI July 20, FOMC July 28-29, ISM August 3, payrolls August 7, and Jackson Hole at the end of August - where a Fed that may have just hiked gets to explain itself without a dot plot. One structural note to carry: the Q3 JPM collar that rolled on June 30th put the new long put around 7,050-7,100. That’s the level where dealer gamma re-anchors, roughly 6-7% below spot - the structural floor under any CPI tantrum. Do keep this in mind if you’re caught with decent profits on your hedges.
Next week I’ll take the recomputed analogs into the Analog Explorer and walk through what 1996 and March 2021 each did to a book over the following six months, because those two are now the bull and bear case wearing historical clothes.
Thanks for reading! And thanks for subscribing to the newsletter.
DISCLAIMER: Neither the survey nor any of the contents of this website can act as investment advice of any kind. The results of the survey need not correspond to actual market preferences or trends, so they should be interpreted with caution. Oraclum Capital, LLC (Henceforth ORCA) is a management company responsible for running the ORCA BASON Fund, LP, and for organizing a survey competition each week, where it invites the subscribers to its newsletter (this website) to participate in an ongoing prediction competition. The information presented on this website and through the survey competition should under no circumstances be used to solicit any investment advice, nor is it allowed to be of commercial use to any of its readers. The survey and this website contain no information that a user may use as financial or investment advice. All rights reserved. Oraclum Capital LLC.