

Resolution or destruction?
Testing the 200-day SMA

Quick summary:
2nd week of the Q2 competition is up and running - click here to join the action. Q1 survey cash prizes will be processed this week!
SPY has shifted from a structural uptrend to a volatile range, pressured by oil-driven inflation despite resilient earnings.
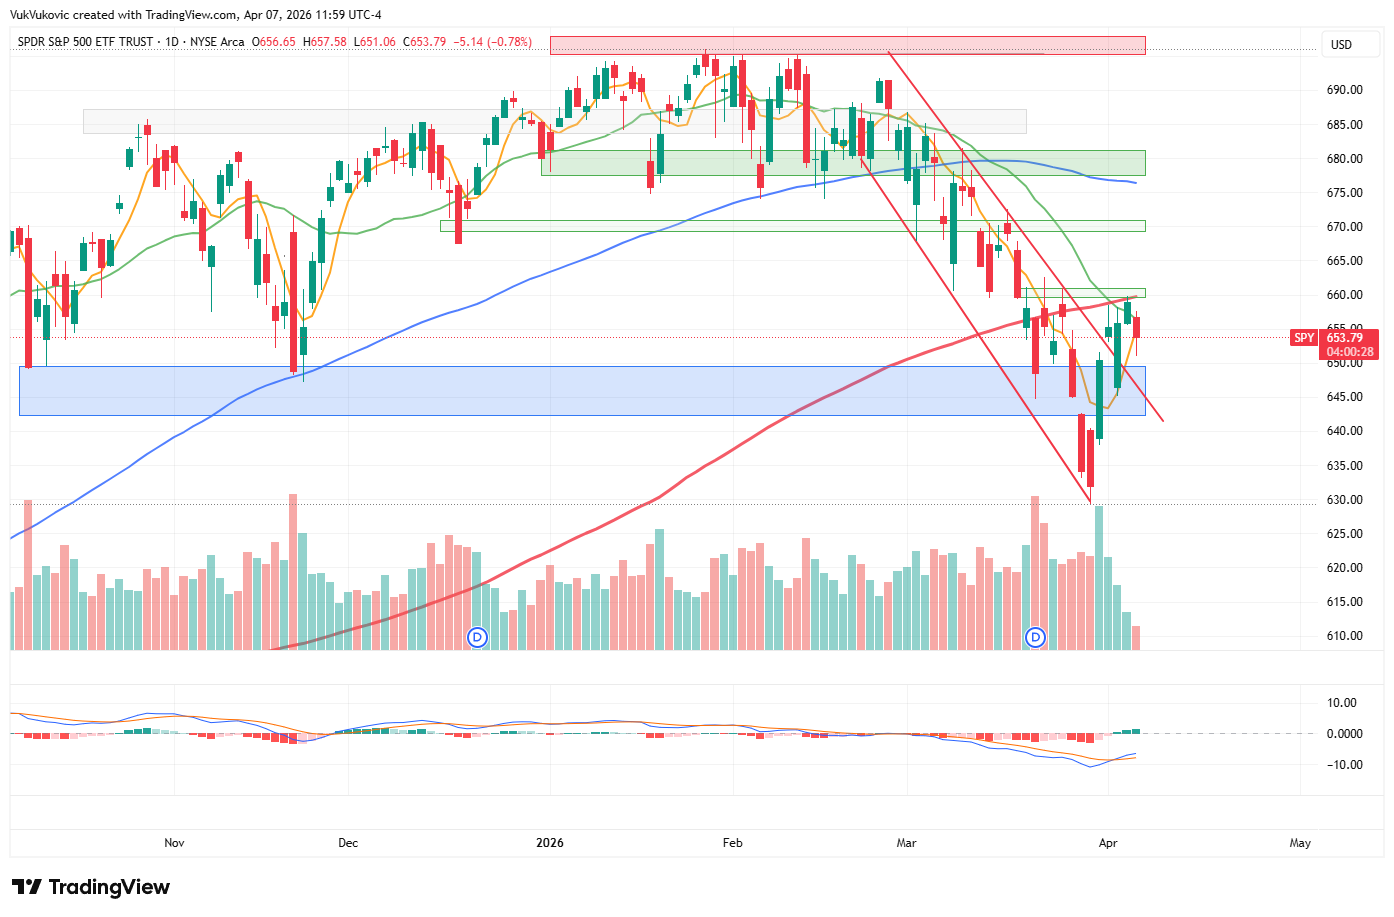
Key Levels: The 200-day SMA at 660 is the critical line in the sand. A failure here targets the 643 support shelf.
The 4hr trend remains bearish (lower highs), though RSI divergence suggests the “dip” is nearing exhaustion.
The Scenarios: A reclaim of 672 signals a recovery toward 687; a high-volume break of 650 opens the door to 630.
Catalyst: All eyes remain on the Iran-U.S. geopolitical deadline as the primary driver of volatility.
Charts:
SPY is currently navigating a high-stakes tug-of-war between resilient earnings growth and the inflationary tax of triple-digit oil prices. On the daily chart (see below), we broke above the downward channel for now, and if we keep sustaining upward momentum that could be a good thing. However, we bumped into the 200-day SMA, near 660 - remember how that used to be a strong support before? Well now it seems like important resistance. We would need to close above it for the rally to have some legs. A daily close firmly below this shelf, confirmed by the current bearish MACD crossover, would shift the focus toward the S2 support zone near 643, effectively testing the Q1 lows.
On the other hand, notice the low volume we keep getting the past two days. This could be a sign of exhaustion, and perhaps everyone is just waiting for tonight’s 8pm deadline over the Iran war. Let’s hope for a peaceful resolution there.
On the 4-hour timeframe, many are seeing a reversed heads-and-shoulder pattern (from end of March to early April), and there have been some higher highs and lower lows reported since that March 30th low, but once again, the same resistance at 660 is proving difficult to penetrate through.
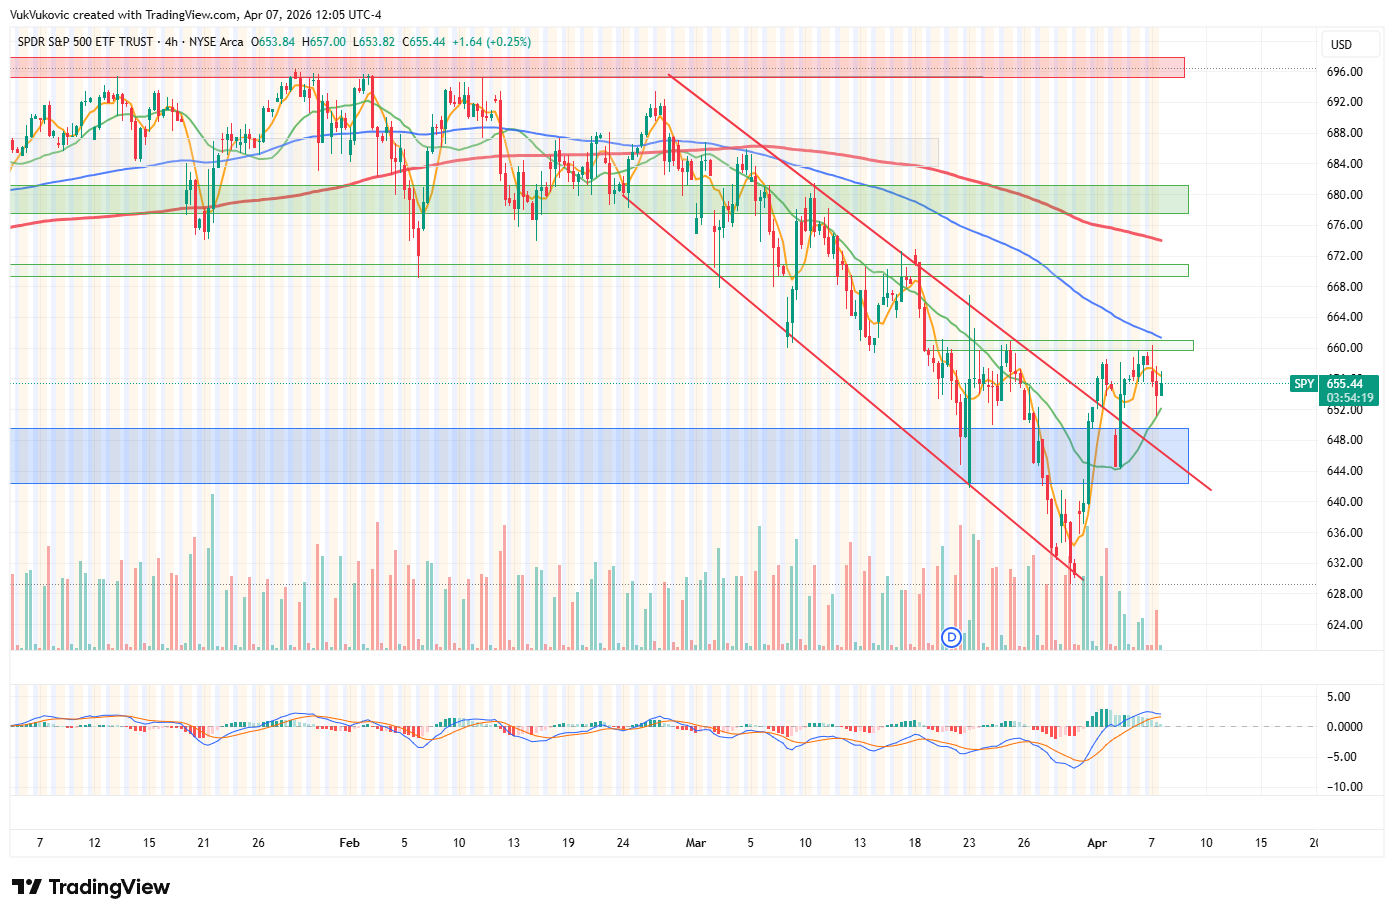
Two primary scenarios emerge for the week(s) ahead: a bullish recovery would require a high-volume reclaimed of the $672 pivot, potentially targeting a move back toward $687; conversely, a bearish continuation triggered by further escalation in the Middle East could see volume spike on a break of $650, leading to a deeper search for liquidity at the $630–$635 level.
Good luck on the prediction!
The competition
Markets are entering a phase where narratives are shifting faster than prices. That usually doesn’t last, and when it resolves, moves tend to be decisive. Join the competition!
Stay focused and keep climbing the ranks!
NOTE: For all those new to the whole thing, read more about it here or watch a video of Scott and myself guiding you through the survey, showing you all its features, and briefly explaining how the competition works.
…join the $32,000x competition!
Join our survey competition to get an opportunity to participate in our quarterly ($8000) and annual (3% of our GP’s profits) prize distributions:
DISCLAIMER: Neither the survey nor any of the contents of this website can act as investment advice of any kind. The results of the survey need not correspond to actual market preferences or trends, so they should be interpreted with caution. Oraclum Capital, LLC (Henceforth ORCA) is a management company responsible for running the ORCA BASON Fund, LP, and for organizing a survey competition each week, where it invites the subscribers to its newsletter (this website) to participate in an ongoing prediction competition. The information presented on this website and through the survey competition should under no circumstances be used to solicit any investment advice, nor is it allowed to be of commercial use to any of its readers. The survey and this website contain no information that a user may use as financial or investment advice. All rights reserved. Oraclum Capital LLC.
And, as always, don’t forget to subscribe to the newsletter.