

The bears🐻 have awoken.
Paid subscriber analysis

Q1 is all but over and it’s been a pretty bad quarter for all asset classes except commodities. US equities are down (SPX -7%, NASDAQ -10%), global equities -6%, US bonds -2.5%, BTC -15%, and even gold, which was up 20% in January, is now up only 4.8% for the year (it was down for the year at the beginning of the week). Silver, the most exciting asset in January, is now negative -1% YTD. Oil is over $100, the VIX is over 31. That’s all you need to know to conclude that things are looking very very bad.
ORCA, on the other hand, is having one of our best quarters, ending up 9%. Amidst all the uncertainty from earlier in the year, as well as very elevated volatility (and hence expensive options prices) this is a terrific result. I’m more proud of these 9% than some of our double digit quarters achieved in the first two years.
But, more on this next week: we will present the quarterly results for the Fund on Tuesday, when we will also announce the winners of our Q1 competition.
Don’t miss Tuesday’s post!
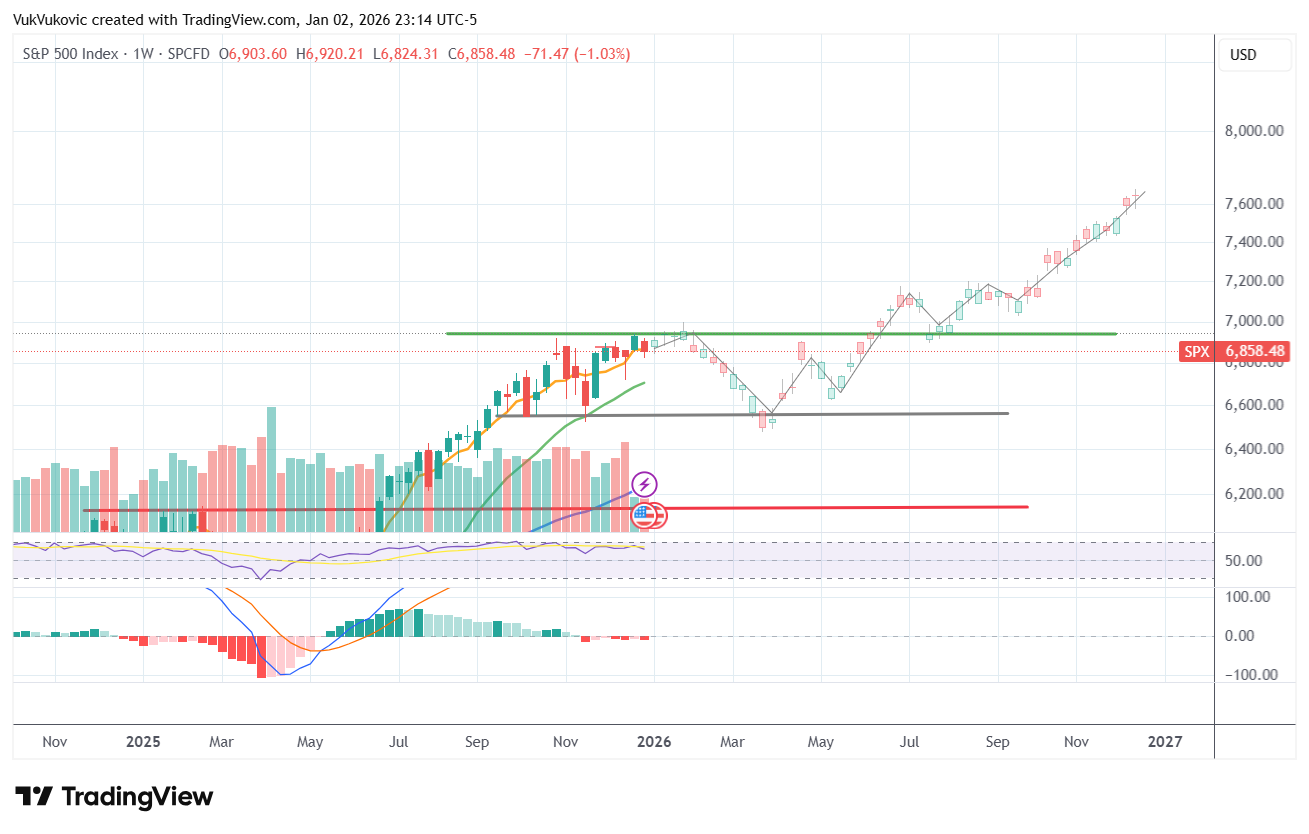
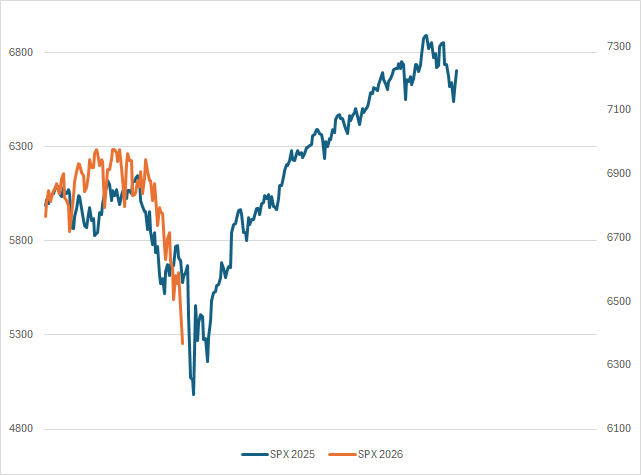
Who could have predicted this poor start to 2026? Well, not to brag, but we did, in our Jan 3rd post where I presented a bullish and bearish outlook on the key technical levels to watch coming into this year.
The bearish view said we should get a dip towards the end of march, eyeing 6,450 on SPX (we closed the week at 6,368). And then we get a brief rally by mid April, followed by another leg of selling well into May, all the way down to 6,000.
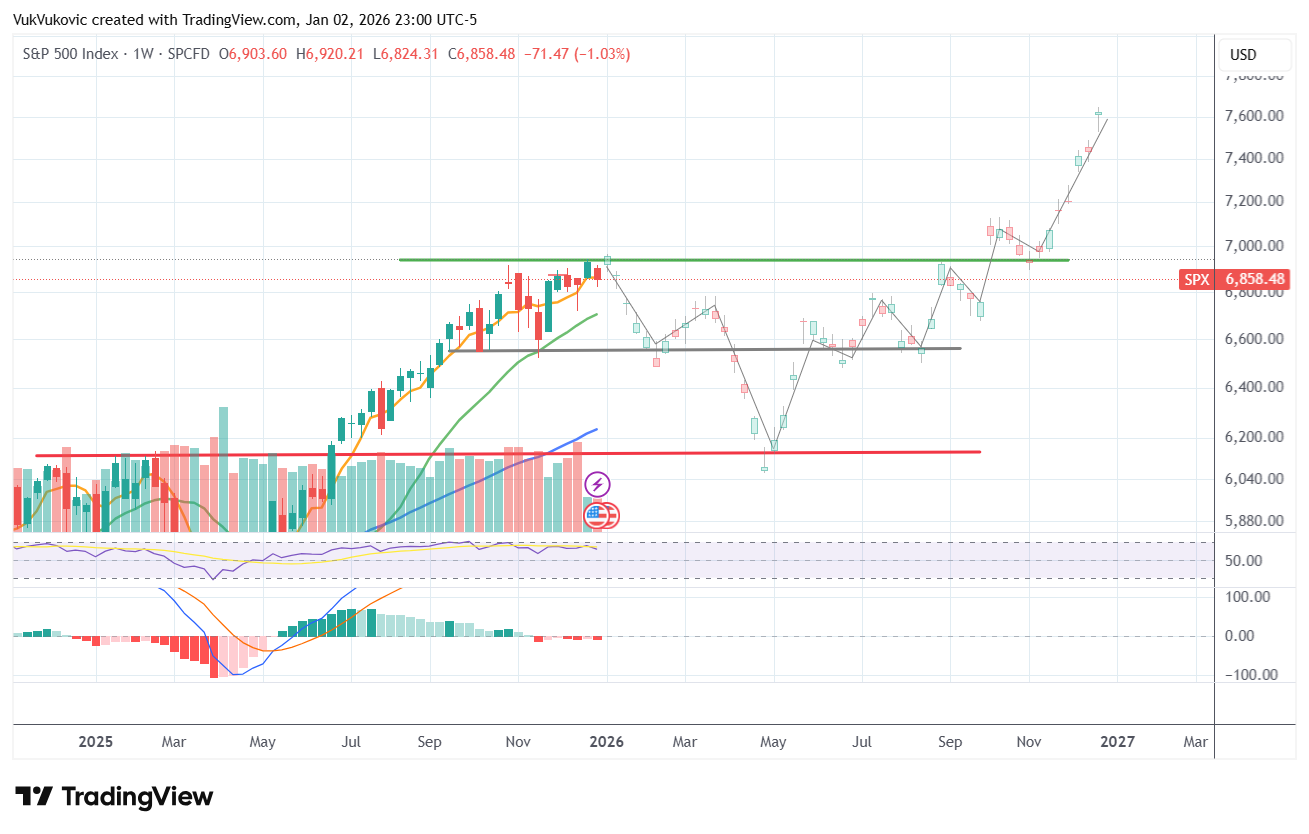
The bullish view expected a more gradual sell, where we should have been down at 6,500 by April, after which we start to bounce back up.
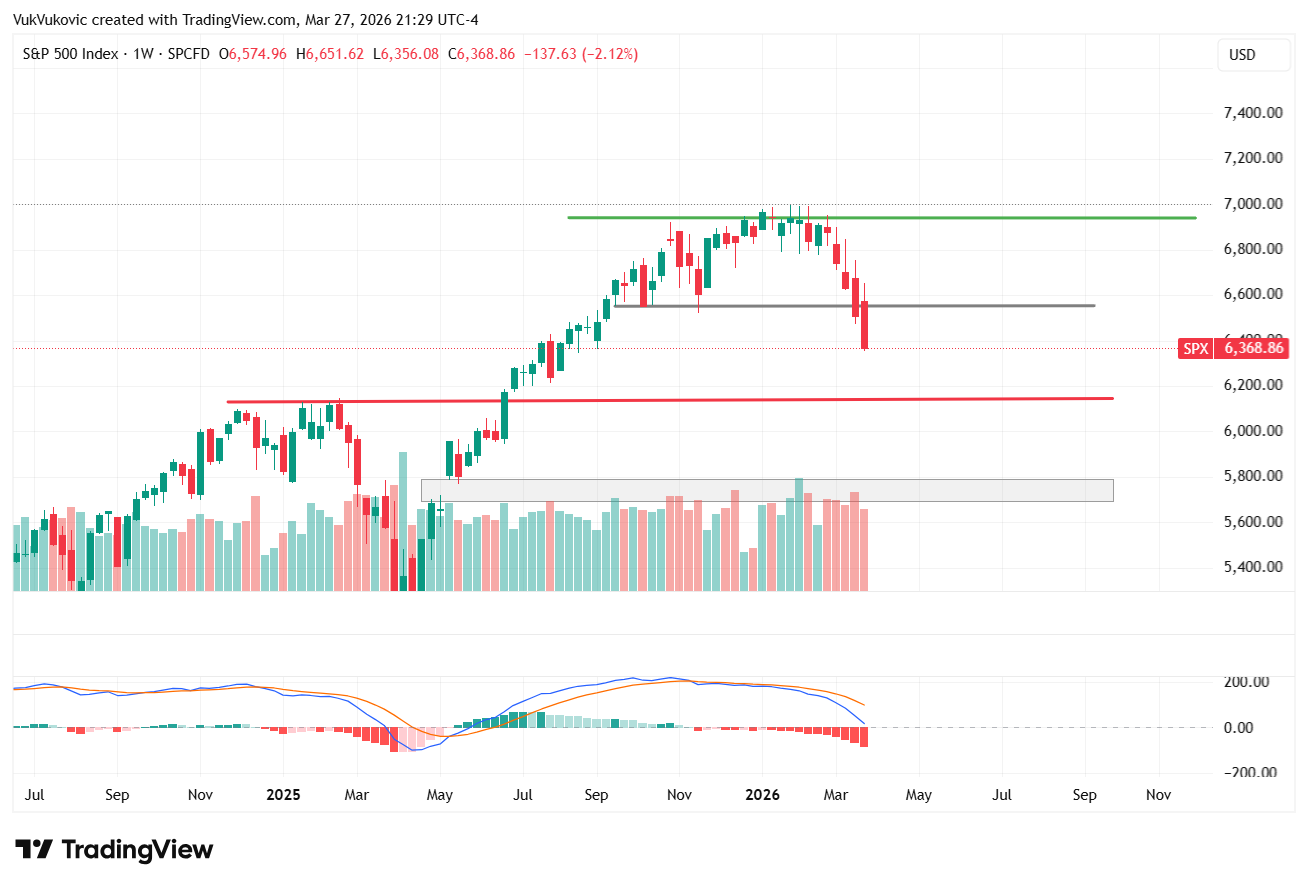
The major unforeseen development? The Iran war. This triggered the bearish scenario, in which the 6,000 level on SPX might actually happen well before the end of May. With a downside that opens all the way to 5,700-5,800:
The Feb/Mar seasonal weakness proved to be accurate once again and we are now in a situation where investors are desperately waiting for some signal of resolution of conflict. A resolution that needs to be bilateral (i.e. both sides have to come to an agreement, which is becoming less and less likely with Iran’s erratic leadership), and a resolution that needs to address the oil supply shock asap.
The effects of Trump's war negotiation announcements (i.e. social media posts) are experiencing an exponentially lower shelf life. They used to last for a few days, now it's not even an hour (see Thursday after close). As long as there is no end in sight and all messaging is unilateral, expect the selling to continue. I do, however, think that the bond market will exert enough pressure for the Trump administration to pull the plug, like it did in April last year. We are very close to those dangerous levels now. Just look at how the 2Y shot up to 4% during March:
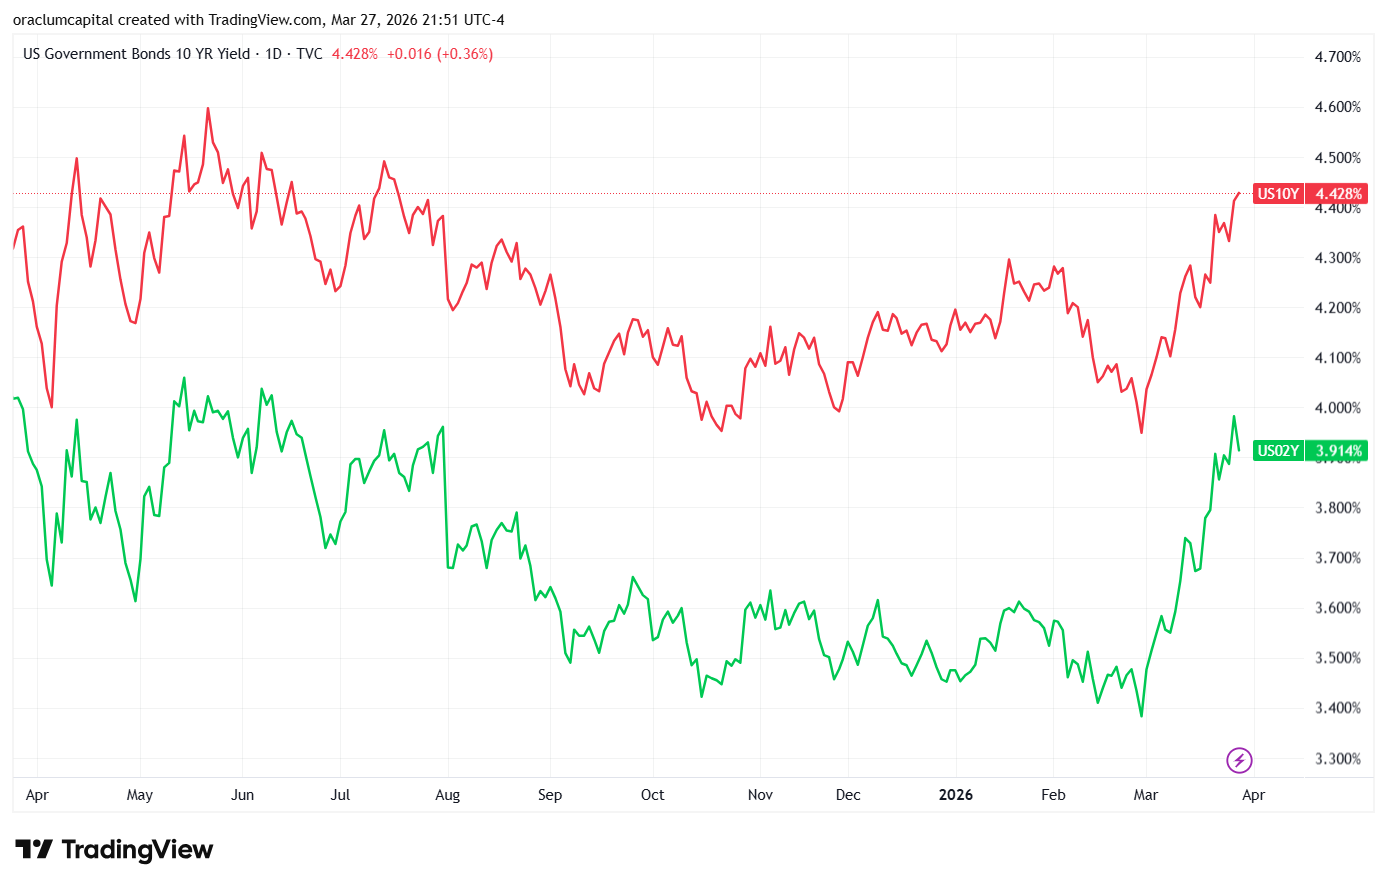
Remember, the 2Y yield is the best approximation of what the market expects from the Fed. Back in 2021, amidst rising inflation, it kept going up signalling that the Fed will have to start raising rates soon. It was a decent 6-month leading indicator back then. Maybe we see the same thing again. The longer the oil shock lasts, the higher the probability we get rate hikes this year. Yikes!
Interpreting the capitulation signal
On the technical side, volume was lower than last week, although still elevated. We are now oversold on all the technicals, which warrants some kind of a relief rally. If this were to be a proper bear market, we would get a few days or even weeks of relief rallies before plunging down further.
This, in fact, seems to be the most likely scenario right now. Imagine the war resolves in some way, and we get our rallies due to oil going down, but the structural weakness is too high, and we keep selling below the current lows. That fully aligns with the bearish scenario from our Jan 3rd analysis.
The general technical structure of the SPY and QQQ suggests a market in the throes of a tactical correction. The price action is defined by a series of stop hunts and liquidity grabs designed to wash out leveraged positions and established stop-loss clusters.
SPY has experienced a clean breakdown from its recent bear pennant formation, gapping below key support levels. The index has lost its 200-day moving average for the first time since March 2025, and has gone through all its major support levels quite quickly. This suggests a structural shift that signals a move from a momentum-driven regime to a volatility-driven one.
The RSI reading below 30 is a deeply oversold signal that has historically preceded tactical countertrend rallies. Furthermore, the McClellan Oscillator has begun to record higher lows despite the index hitting new price lows, suggesting that market breadth is starting to stabilize beneath the surface. It smells just like a bear market rally coming up. These are always dangerous to play with.
The analogs are also looking dangerously in sync. But this is not like tariffs where Trump could bluff his way out. It’s a different game entirely.
The JPM Collar: structural impacts and month-end flows
A defining feature of the late-March market environment is the influence of the JPMorgan Hedged Equity Fund (JHEQX), a large-scale mutual fund that manages a Put/Spread Collar strategy. This trade is not merely an investment position but a structural force that anchors billions of dollars in passive equity exposure to a systematic options framework. It’s gives us very important levels to watch for March 31st.
