Amidst a window of weakness, all eyes👀 on earnings next week
Paid subscriber analysis
We ended last week’s analysis with the following conclusions:
“So for now, the probability of a Soft Landing is actually getting higher, although some investors might still be wary if the labor market starts showing signs of weakness.
Earnings will be a big tell on this.
If better earnings continue to show company resilience and meet or exceed their already high expectations, no reason to interpret the macro data as a slowdown.
But if earnings start to disappoint, the pricing in of a slowdown becomes very quick, and we might go through another correction like in April (also during earnings season if you recall).”
Did earnings start to disappoint, and was this week a signal of an April-style correction?
First, let’s see what happened this week.
Options are the tail wagging the dog
This week’s sell-off was greeted by many investors as a much needed pull-back. It happened just as we entered the options-driven “window of weakness” following VIX expiration on Wednesday (more on this below). Three full days of selling. Not too aggressively, but just enough to trigger a few technical levels, and bring at least some joy to bears. SPX ended the week down almost 2%, NASDAQ down 3.5%.
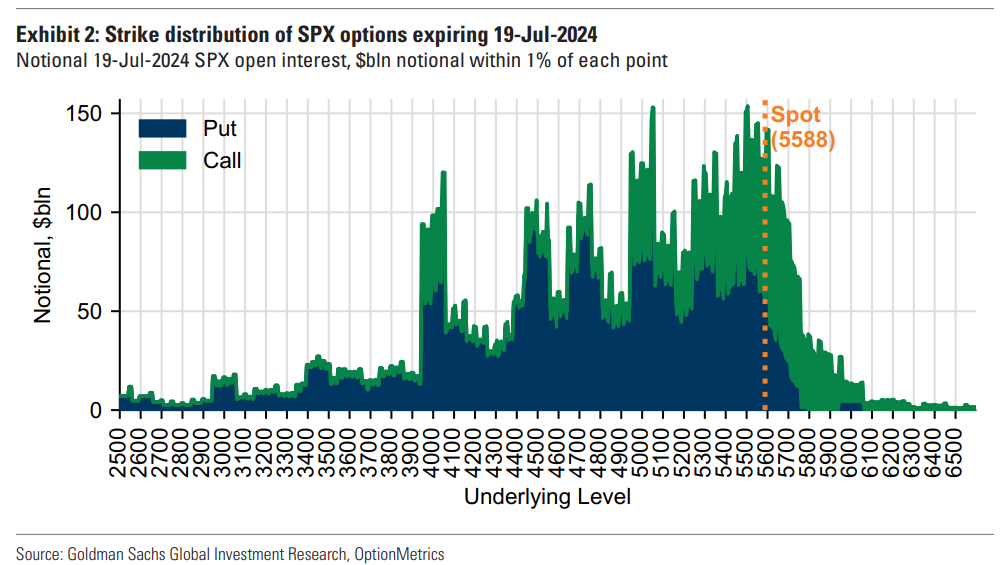
We had the biggest ever July option expiration yesterday, on Friday July 19th, where over $2.7 trillion of notional options exposure expired, including $555 billion on single stocks (see figures below). The options market is getting so big and influential, it is of imperative importance for investors to start understanding its flows. Just this notional value of SPX and single stock options expiring yesterday was about 5% market cap of the Russell 3000 index (an index that measures 97% of the US publicly traded firms). That’s enormous. And when these options expire, they can often trigger large buying or selling flows which pull the market strongly in either direction. As they did this week, on the way down. The options market has indeed become the tail that wags the dog!
Also notice the composition (above); because SPX and SPY options dominate options expiry over single names, that’s why you can get such huge divergences, where SPX can go up while over 80% of stocks are going down, and vice versa.
The index options themselves invite so much flows that market makers have to hedge their positions by either buying or selling the underlying index, not single names, pushing it up or down aggressively at certain points. Market makers can either act as stabilizers of amplifiers of market movements, depending on their positioning and the current market environment (measured by something called gamma exposure; more on this another time).
Most of the time they act as stabilizers, which is exactly why we usually find support and mean reversion even after very strong sell-offs (like the one from this week). If you look back the past two years, ever since we got out of the 2022 bear market - which never really fully materialized as expected, especially not in 2023 - the biggest support in this period were 0DTE options (options expiring on the same day).
As you can see in the figure below, these dailies have, since Q3 2022 (when 0DTE was introduced for *every* day) completely dominated SPX volume. They are the driver (the tail that wags the dog) and because of them, you will usually find huge support from market makers in all market regimes. It could very well explain why we never got that massive market crash towards the end of 2022 (SPX to 3000) or in 2023.
But right now, the crucial question is, will the current mini sell-off continue into next week, or do we find support? The options market also offers something called a window of weakness each month (watch this video to understand what that means).
We are now in that window of weakness, typically a window that opens after VIX expiration, and closes with end of month flows, where the underlying index is losing its usual supporting flows. It’s a short window, but it can turn into something larger if the SPX starts breaking key technical levels on the way down (like 50MA on the daily).
A window of weakness basically means that if macro flows turn against the market for any given reason (like as a consequence of some major event), they are most likely to materialize during that window, where we don’t get the usual supporting market maker flows (e.g., even COVID for example did not start the major sell-off until after VIX expiration).
Does this happen every month? Obviously not, but it makes sense to prepare for it using hedges, knowing that the probability is higher, especially if we also see overbought conditions on the market, or are expecting a pullback due to negative macro data or whatever.
Having said that, I personally expected an easier July, continuing sideways-up most of the time, and for something like this to happen during the August window of weakness, coming into September (similar to last year). I’ve even said this last month, with an apt title: “More of the same” (expected for June and July).
As if the market cares what I think :)
So it very well could be that the correction started a month earlier than I’ve anticipated.
We will get a definitive answer to this after next week’s earnings.


