I wanna start you off with a little story you might not have heard before.
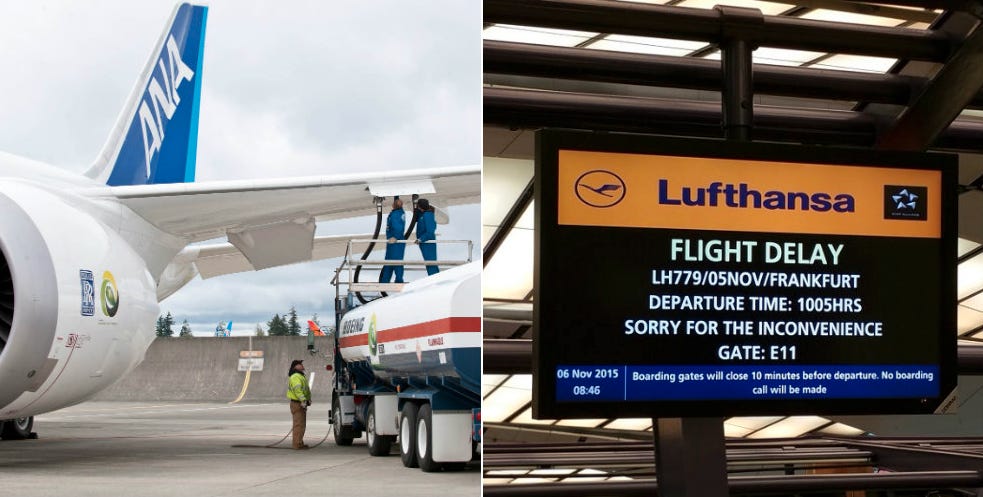
The Board of the airline company Lufthansa asked their controlling team to come up with one powerful, forward-looking KPI that accurately conveys what’s happening with the company. After months of number crunching, they came up with one number:
Minutes of flight delay.
Lufthansa is a huge global corporation, with a number of issues to monitor regularly: from worker strikes to plane and passenger safety, from cargo load to fuel costs.
The Board felt like they were missing something. They wanted to look beyond the standard business indicators or the typical airline indicators (like passenger load factor, available seat miles, revenue & cost per seat mile, passenger yield, and so on) to anticipate performance. So they asked controlling to wrap it all up in one simple metric.
The solution was almost too easy (even though it took a while to get there). The controlling team found that total minutes the Lufthansa flights are delayed affects everything: revenues, operating expenses, customer & employee satisfaction, & all the usual airline KPIs.
The bigger the number, the worse off the major indicators, and the Board could expect a bad quarter. And vice versa. It was a perfect forward-looking indicator. The Board’s focus shifted after this, and their mandate became to minimize all delays to their planes. Minutes of delay became the crucial benchmark according to which the Board measured their own success.
The yield curve inversion
The yield curve is the closest thing investors have to something like this.
Not just because of its historical “predictions”, but because it's a simple indicator that sets in motion a self-fulfilling prophecy.
How does it work?
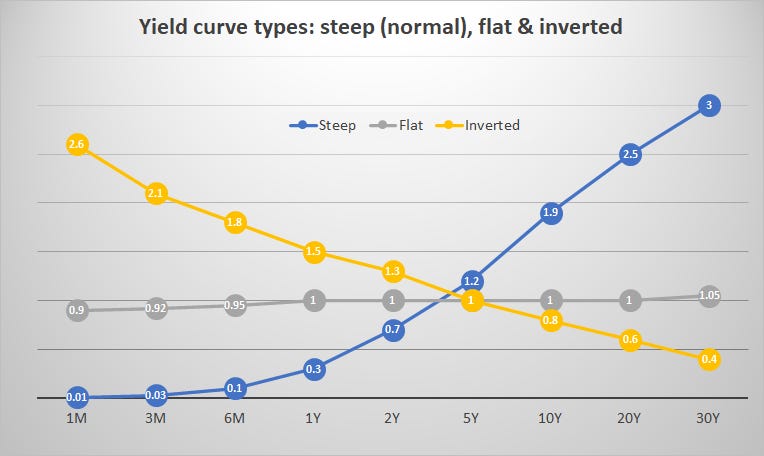
Basically, it gives you an indication of the boom-bust cycle. An inverted yield curve (👇 in yellow) means you get a bigger return when buying assets that mature in a few months or in 1 or 2 years, than those maturing in 10, 20, or 30 years.
This is very counterintuitive. Typically, it's the other way around. When you put your money into something you don't touch for 20 years, it's more risky (hard to tell what might happen), and so you demand a higher return. But when it's more profitable to put money into assets that mature in a year or two, rather than 20, well, something is off.
Why does this happen?
As the economy starts to overheat (e.g. higher growth and/or inflation expectations), the Fed reacts by raising short-term interest rates, thus affecting short term Treasury yields. Yields on short-term rates (left side of the curve) go up and stay up. As short-term rates keep going up, investors become worried about an upcoming recession.
Why? Because the Fed is now signalling that the economy is overheating (and it’s a very credible signal), so expectations need to adjust. Investors literally start anticipating a recession.
Investors expect short-term rates to fall in the future (the Fed will cut rates in a recession), so they start buying long-term bonds. As the demand for long term bonds go up, bond prices go up 🔼, and yields go down 🔻 (remind yourself of the mechanism here).
But wait, over the past few weeks, investors were mostly shorting (selling) bonds, and their yields shot up.
Indeed. This usually happens when the Fed starts hiking rates.
Why? Because you buy a bond at a fixed coupon rate. If you bought in 2020, your coupons were around 1% on 20Y T-bills. Note the graph below, other yields were even lower, less than 0.5%.
When interest rates go up, new bonds are issued at higher coupons. And your current bonds are worth less. So you sell, thus driving up yields. You sell more of those 2Y or 5Y bonds (coupons were 0.1% 2 years ago), than 10Y or 30Y bonds.
Hence the inversion. Do you see it?
(Note: not the entire curve, though, because the <1 year rates move closely with the Federal funds rate which is still at 50bps, but is projected to go to 200bps by the end of the year - this is why the 3m10Y spread is usually a more lagging indicator than 2Y10Y or 5Y30Y spreads).
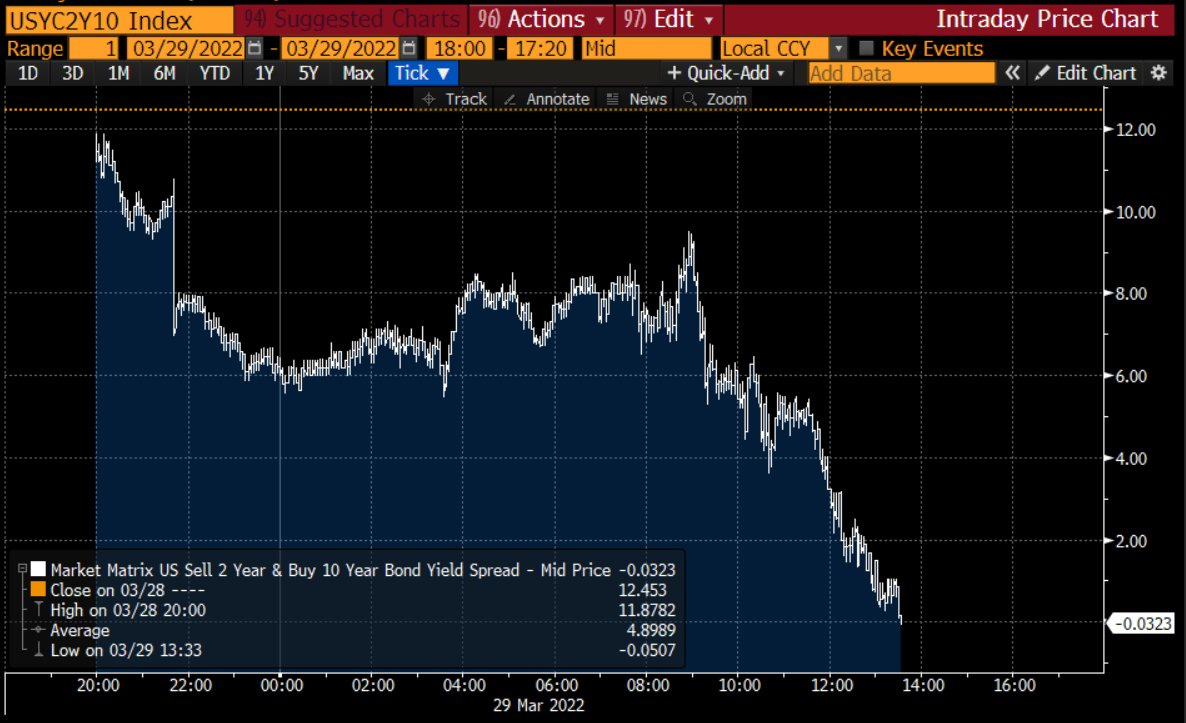
As the Fed hikes more and more (7 times expected this year, bringing it up to 2%) more long term bonds are bought, and their yields go down further. And so we get an inverted yield curve - best observed through the 10Y-2Y spread (which first inverted a few days ago, and again today).
It's a self-perpetuating and reinforcing (Soros calls it reflexive) mechanism that sends signals to investors and at the same time drives their reactions. A self-fulfilling prophecy. When it happens, a recession is due in 6 to 12 months.
Obviously there are many other indicators out there, some of which are perhaps better at recognizing market peaks. Things like:
consumer confidence
total hours worked
manufacturer's new orders
new building permits issued
and so on…
But the yield curve inversion is so simple - like the Lufthansa minutes of flight delay - that it's the one indicator any retail investor can understand and keep track of.
Remember, when the 10Y-2Y spread turns negative (as it has today), a recession becomes a self-fulfilling prophecy. It might take 6, 9, even 12 months to get there, but we're getting there. Adjust your plans accordingly.


historically it takes a bit more than a single intra-day dip on the 2-10...
https://twitter.com/yieldcurvetrack/status/1507072505197973518?s=20&t=XgltJOFuFQP1mqVPtepgJQ