Announcement: changes on the newsletter
Before we dig into today’s topic, I wanna give you a quick overview of what you can expect from this newsletter going forward.
The main change is that we wanna make our fund even more accessible, by offering direct insights into how our hedge fund designs its macro investment thesis, and how it performs its monthly and weekly positioning with respect to current macro conditions.
In other words, I wanna give you an insight into how a hedge fund manager navigates markets. Think of it as weekly “memos” you get from me on strategic and tactical positioning with respect to changes happening on markets.
The BASON strategy, our main options strategy responsible for the bulk of our returns, is still available only to our investors, but parts of our macro positioning strategy is something that can deliver considerable value if you’re merely looking to see how we do our work, and how I personally formulate my thesis, give it probabilities, and design tradeable strategies.
This type of content will not remain free, however. Anyone who wants to get strategic and tactical macro positioning on a continuous basis with have to pay for it. We won’t be charging paid subscriptions until September, so over the next two months, every Thursday, you will get a good idea into what these pieces will look like, and the value they can bring.
The content related to the survey, fund performance, and other educational pieces will remain free, but they too will be enriched with more details.
Today, we start with the first such “memo”, revisiting the strategic macro positioning, and examining the potential impact of Q2 earnings.
Follow-up on bull market or bull trap: has it changed?
If you read my piece from two weeks ago, I questioned the validity of the bull run argument. The conclusion was that even if you are long in AI-related tech stocks (kudos if you are, you probably did well this year), it would be a decent time to enter hedging positions which would protect you in case of a correction to the downside. In other words, to buy (relatively cheaper) insurance. This is still the right long-run strategic view (with lower delta options - e.g. 5% OTM puts on SPX with 2 month expiry are trading at less than $2.5 per contract, 10% OTM with 3 month expiry, roughly the same price. This is a decent price for a hedge).
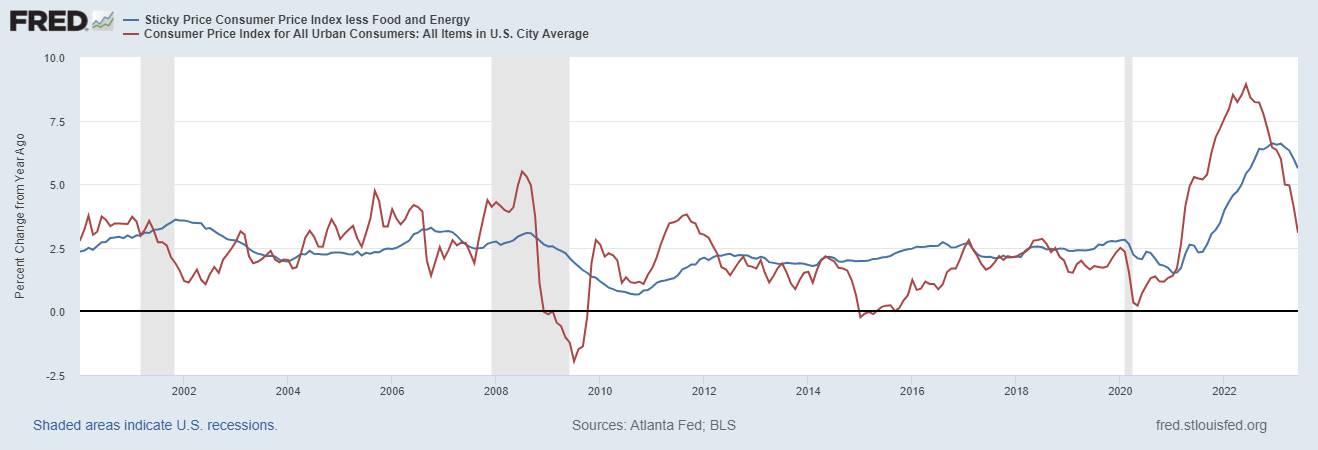
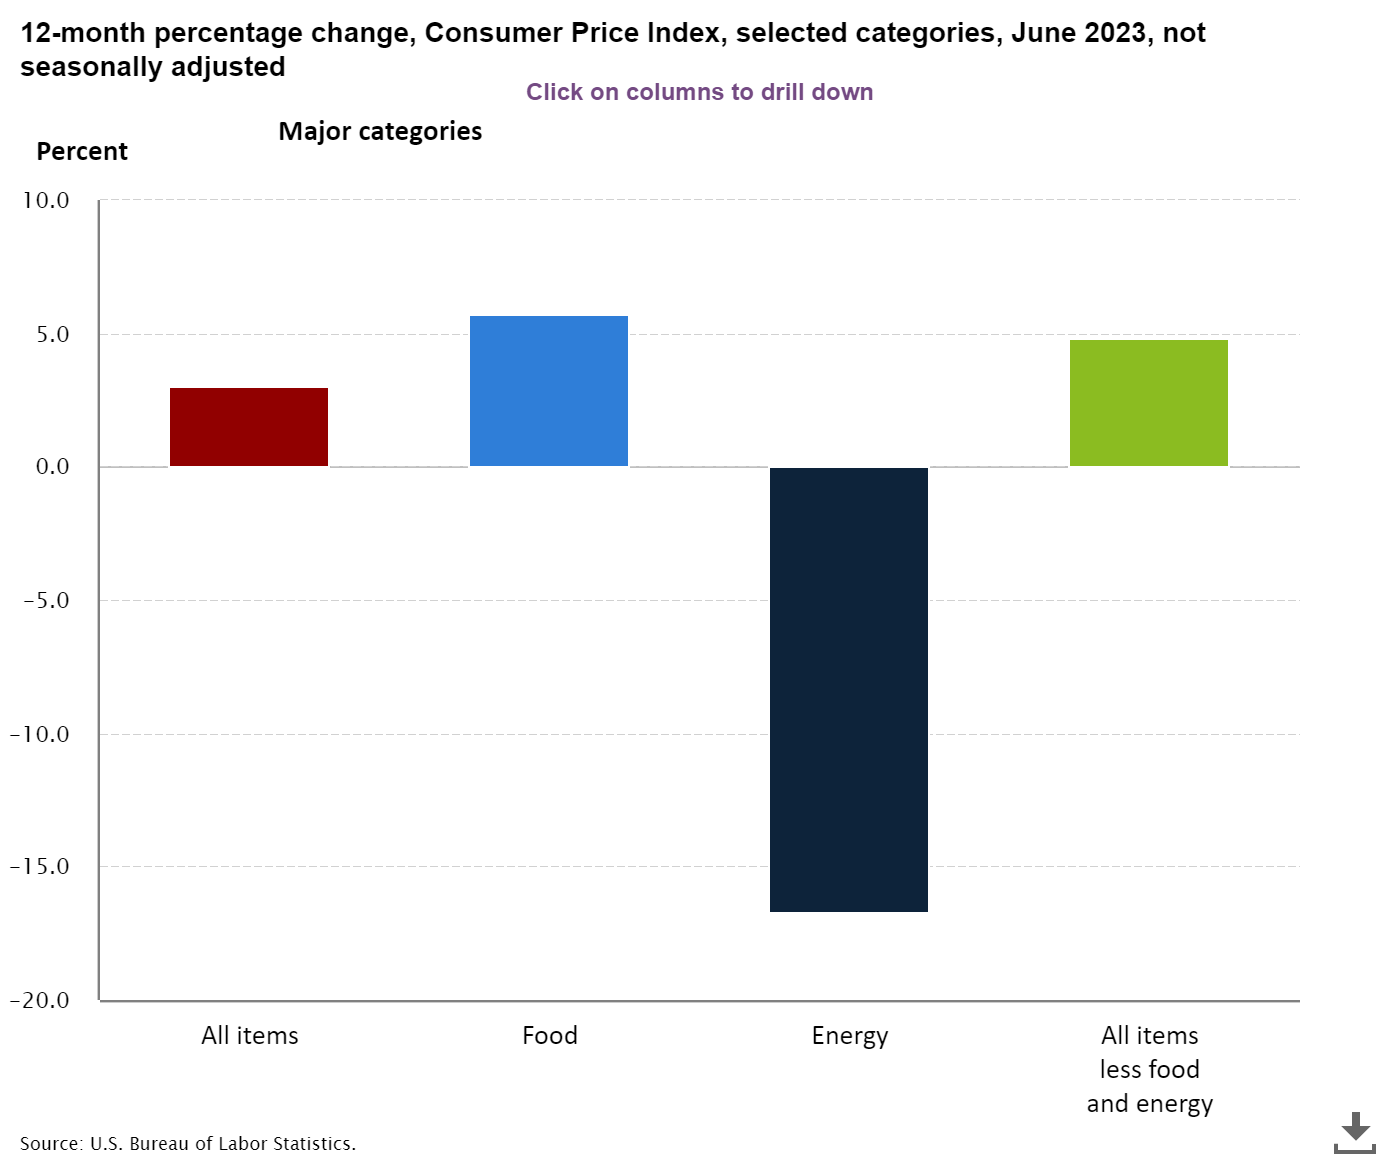
The short term tactical view has, however, been altered with yesterday’s CPI that came in lower than expected, for both the main CPI (at 3%), and core CPI (at 4.8%). The core is still high, but a print at 3%, coming down from 9.6% this time last year, continuing its decline during the entire 2023, is a clear sign that high interest rates did the trick in curbing inflation. It is a sign of relief for markets, so yesterday’s gap up open was a natural consequence.
My macro thesis throughout 2023 has been contingent upon two things: 1) inflation was expected to go down and 2) central banks will keep rates higher for longer, until core inflation is back to 2%. This is still valid.
Dull, low volatility markets (VIX has been suppressed for a few months now) typically need a catalyst to break the cycle. CPI was the first potential such catalyst, but it ended up adding fuel to the 2023 rally, sending SPX once again at a YTD high.
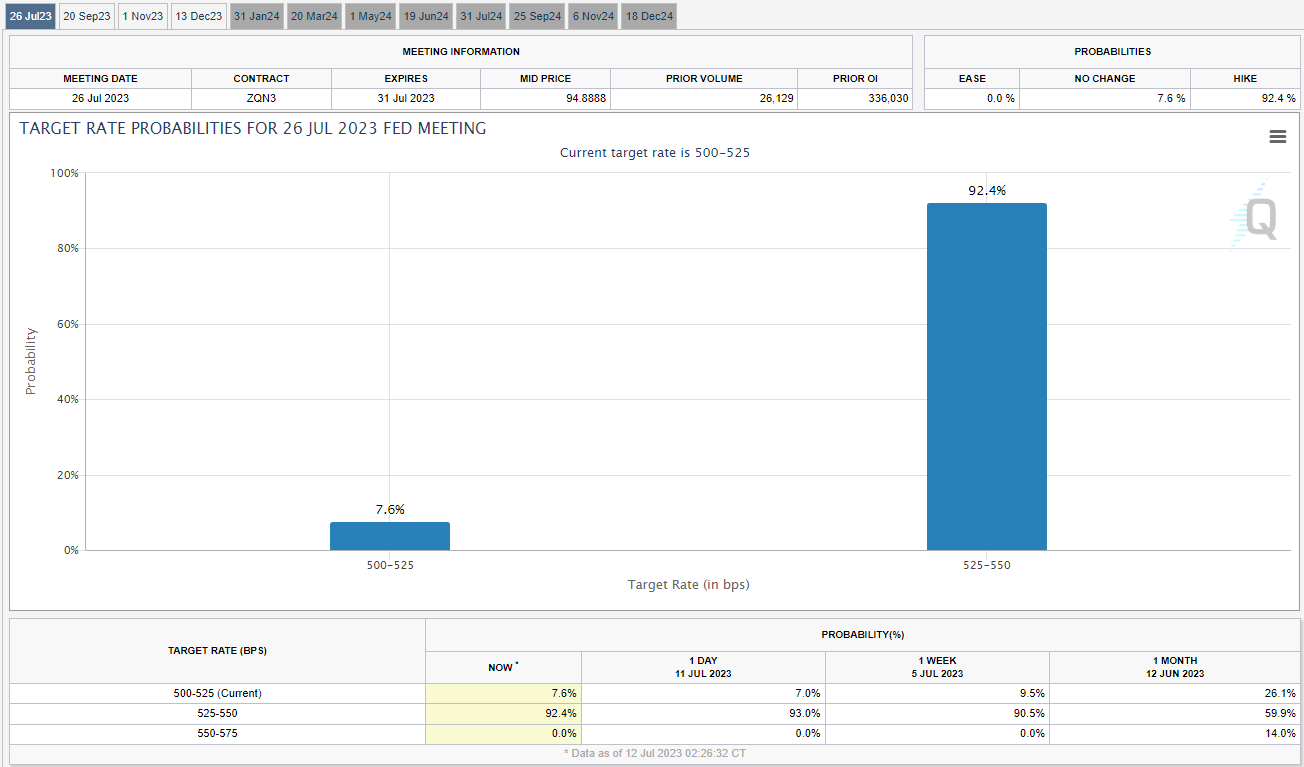
Other two catalysts, in either direction, are Q2 earnings (more on this below), and of course, the FOMC meeting coming up in two weeks, where we will see if the Fed remains adamant in their higher for longer stance. They will be, just look at the expectations: almost unchanged yesterday despite the CPI report.
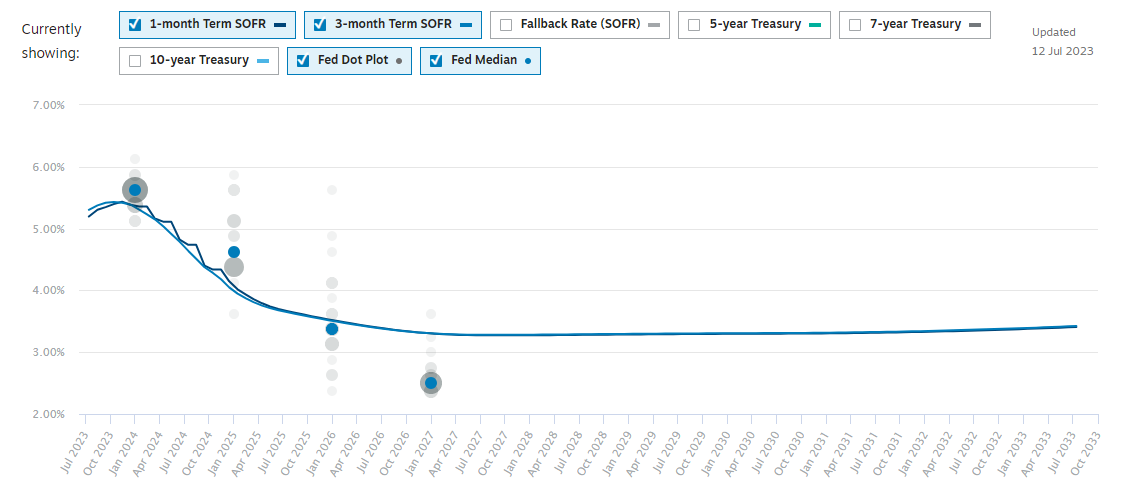
If the Fed turns dovish all of a sudden, and earnings beat the estimates, we might have a stellar summer ahead of us. The more likely scenario, however, is that the Fed raises rates by the expected and priced in 25bps, and that earnings come at a mixed bag. This will keep markets dull, with low volatility, and continuing to grind up. Waiting for that next big catalyst.
Earnings: a catalyst either way
The fundamental/technical divergence continues. Wall Street analysts are expecting an earnings decline for the third straight quarter due to stagnant sales, stagnant revenue growth and depressed margins for the majority of S&P500 companies. On average, a decline of around 7% in earnings per share (EPS) is projected year-on-year.
However, we have heard this exact same argument being given prior to Q1 earnings that were being reported in April, and 2022 Q4 earnings reported in January. And what happened? Markets rallied in January and in April after a decline in earnings. Why? Because the bar of earnings expectations was set too low, and most companies beat the estimates. It was a catalyst that paved the way for a bull market narrative. A bull narrative that still going.
Therefore, the fundamentals are weak (both macro and micro), and yet markets keep making YTD highs. Which brings us back to the main point I keep hammering throughout the past few months. There is a massive divergence between sectors; specifically between a cluster of tech firms and everyone else.
You can see it also in the earnings expectations consensus:
Two sectors that are expected to deliver a decent earnings beat are consumer discretionary (this includes TSLA and AMZN first and foremost), and communication services (this includes GOOGL, META, NFLX, etc.). I wouldn’t bet against the tech sector either, represented by AAPL, MSFT, and NVDA.
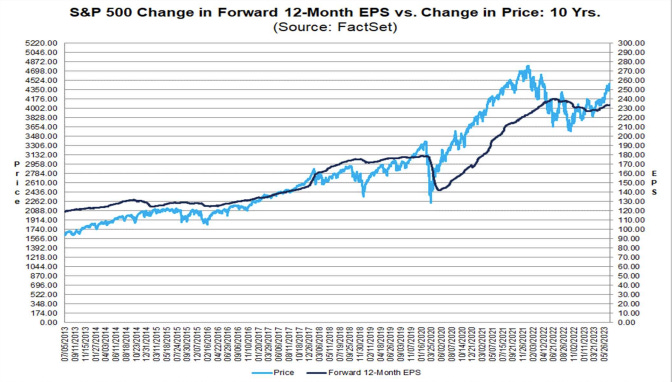
Furthermore, do keep in mind that stock prices typically bottom before earnings do. The forward 12-month EPS looks like to have bottomed last quarter. It would take a significant decline in forward earnings to challenge the bull hypothesis, at least in the short term.
High bar or low bar?
But the main question, especially for each of the aforementioned companies, is whether their earnings estimates constitute a high bar or a low bar?
When the bar is set low, even poor performance delivers a boost to equity returns, provided that companies beat the estimates.
When it is set too high, as, for example, a consequence of very positive EPS guidelines from the previous report, then an earnings miss triggers a sell-off.
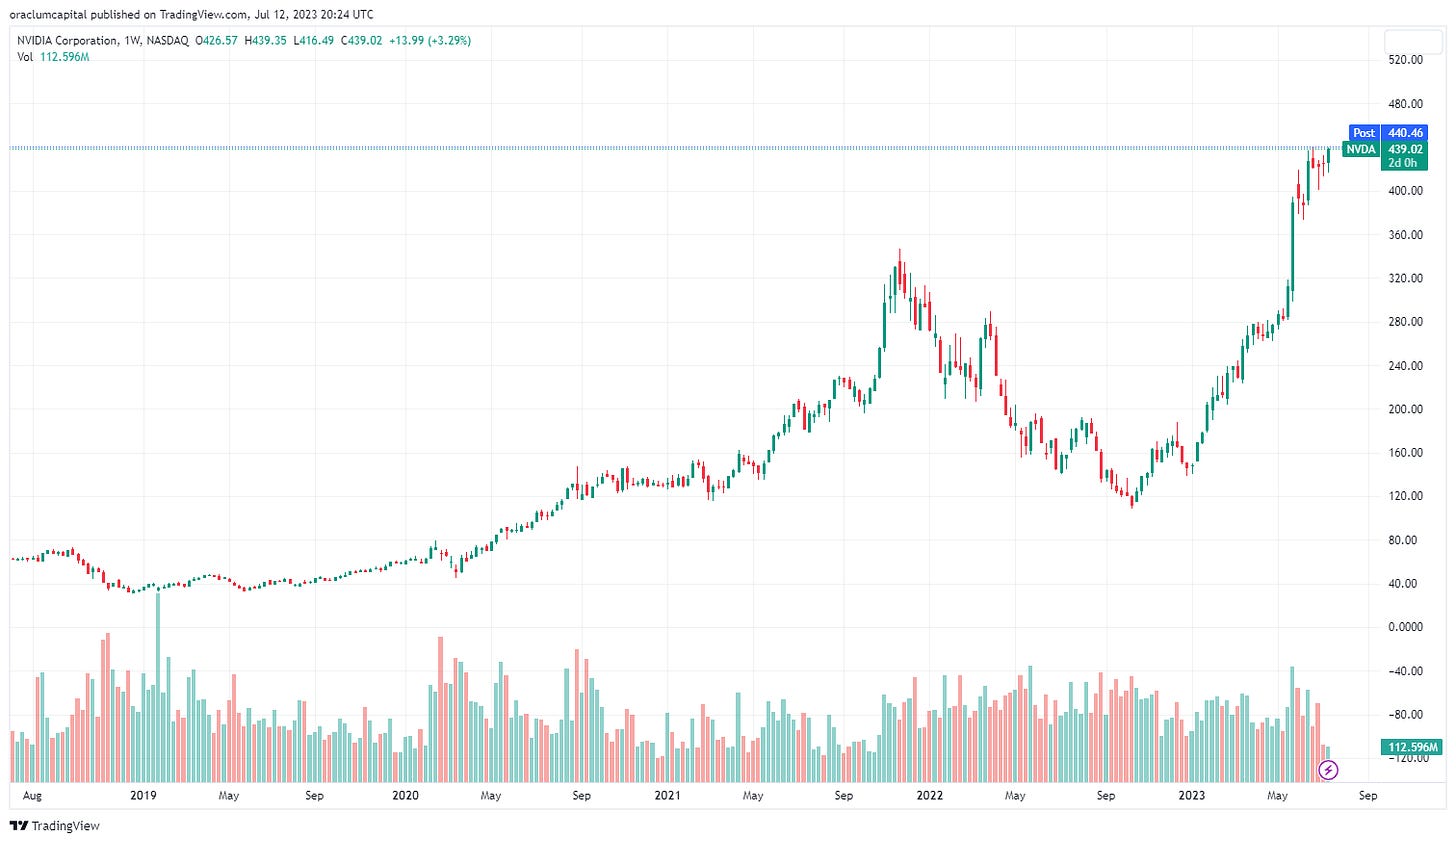
Either way we get a catalyst for a move up or down. This is where tech comes in. NVDA in particular. The prime example of an AI-driven stock, with revenue going up 19% in Q1 as a consequence of increased AI chip demand, sending the company to a trillion dollar valuation. It is still at all time highs, with no signs of stopping:
The company itself expressed a huge upside in expected forward earnings in their latest report (expecting $11bn in revenues in Q2 2024, compared with $7bn now).
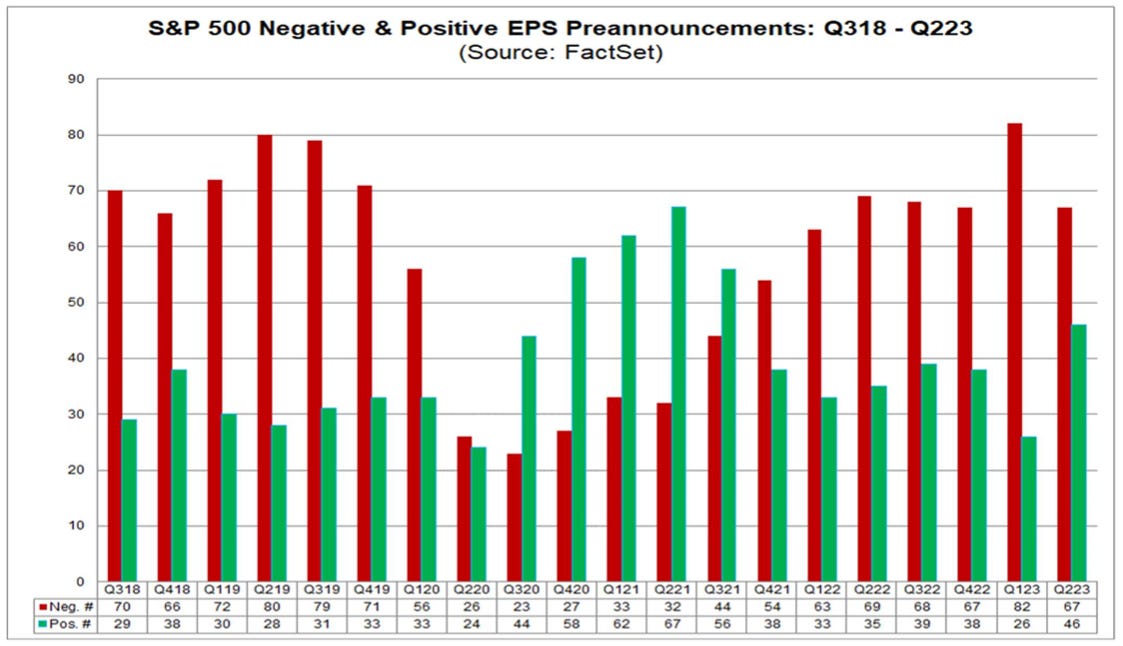
They are not alone in this. Acording to FactSet, the highest number of S&P500 companies since 2021 gave positive forward EPS guidance for Q2. Overall it is still negative, but it’s about the few drivers anyway, not the entire market. We know this by now.
Notice the divergence from Q1 2022 when forward guidance was subdued, and many firms beat the estimates - the bar was really low.
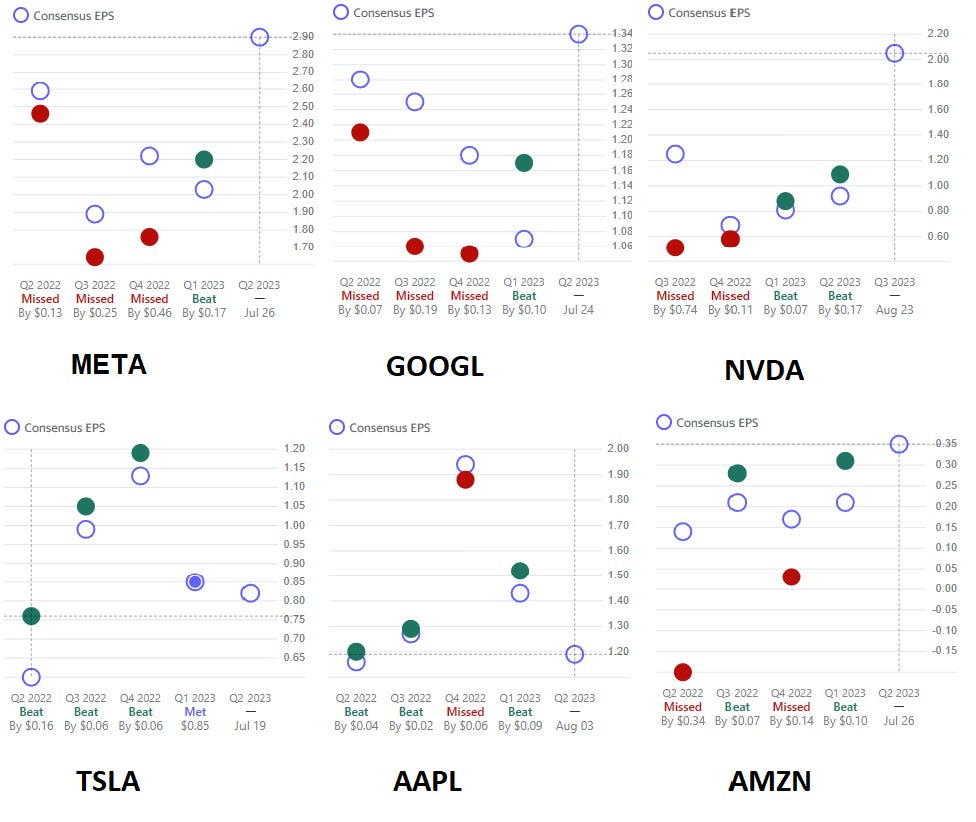
The upper panel of the figure below shows a good example of a high bar given to META, GOOGL, and NVDA. Much higher EPS than over the previous year, which is expected, at least for these companies, but this makes it all the more difficult to reach that level. In the lower panel the bars are set pretty low for TSLA and AAPL for example. Shouldn’t be difficult for, at least AAPL, to clear the hurdle.
The bar is therefore certainly higher now. Most of the aforementioned tech companies, the rally drivers, are expressing high optimism ahead of the quarterly results. This is always a two-edged sword. If there is an earnings miss, they will be punished and will drive the markets down with them. But if they manage to beat, it is hard to see what will stop the markets from reaching new highs this summer. In that case, we can say with a high degree of certainty that there will be no pullback before September. And then, a new strategic allocation will be necessary.
What does all this imply for positioning?
It’s all about probabilities. An earnings beat of the big 6 (AAPL, AMZN, GOOGL, MSFT, META, TSLA) + NVDA will almost certainly add fuel to the rally, especially with the Fed interest rate hikes being priced in. The probability of a rally is >90% if the big 6 + NVDA beat the estimates. However, the probability that all 7 beat the estimates is about 20-30%.
If it’s a mixed bag, then focus on sectors where the main companies beat the estimates. GOOGL and META beats will surely drive the communication services sector (XLC), similar to what TSLA and AMZN might do for discretionary (XLY). Both sectors have a higher probability going up after the earnings season (I would say 70:30 in favor going up). For tech (XLK) watch NVDA, MSFT and AAPL. Whichever group disappoints it is a target for short-term shorts.
Individually, I would place the highest probability of an earnings beat on META, despite the high bar. It has just launched Threads, a powerful alternative to Twitter, and has attracted 70m subscribers within a weak of its launch only in the US. META’s distribution channel is enormous (3bn active users of FB, over 2b for IG and WA), and it will give Musk’s Twitter a run for its money, no doubt. It’s doing the same thing to Twitter what it has done to Snapchat via Instagram stories (and also keeping up competition with TikTok via Instagram Reels). This is hardly the only thing driving positive forward guidance, as do keep in mind that META is another company heavily benefiting from the AI bubble. A positive forward guidance will certainly be there, and an earnings beat - and a positive subsequent reaction - is not hard to envision.
NVDA is given the second highest probability to beat its high bar estimate. AI-driven demand kept growing exponentially in Q1, and it shows no signs of stopping or slowing down. NVDA’s valuation is through the roof, its PE ratio is over 200, making the stock very expensive already, but in this case, it’s all about the future and what the AI revolution can bring. We are just at the start, I think.
Very close to NVDA, with similar AI-driven expectations is MSFT, integrating ChatGPT into its Office365, generating significant upside revenue potential. Furthermore, Microsoft’s acquisition of Activision got approved by the courts this week, making sure we get another positive forward guidance from them.
As for the others, AAPL has a pretty good chance of beating a low earnings estimate, as does TSLA, both of which rarely disappoint. AMZN is difficult to estimate, while GOOGL will likely beat, even though it too faces a steep target.
Finally, if they all (or most of them) miss earnings - which is also a low probability scenario, I would say <15% - then that might be the catalyst the bears are waiting for. In that case, expect the bull trap scenario materializing sooner rather than later. Finally, keep an eye on free cash flow reported by each of these companies. If free cash flow goes down against earnings, that’s typically a bad sign for the company. Having said that, each of the above doesn’t seem to have problems on that front. Sure, in a few cases we can expect slightly lower free cash flow (like AAPL), but the levels are so high it is difficult that this would constitute a big issue.
The rest of the market will surely deliver mixed results. But most of these firms are of little concern. We’ve been witness to a rally throughout 2023 driven by a handful of tech stocks. Their performance will either keep the rally pumping or send markets back down. So far, the probabilities favor the former scenario.
If you enjoyed this, or if you disagree, feel free to drop a comment:
DISCLAIMER: None of the contents of this website can act as investment advice of any kind. Oraclum Capital, LLC (Henceforth ORCA) is a management company responsible for running the ORCA BASON Fund, LP, and for organizing a survey competition each week, where it invites the subscribers to its newsletter (this website) to participate in an ongoing prediction competition. The information presented on this website should under no circumstances be used to solicit any investment advice, nor is it allowed to be of commercial use to any of its readers. This website contains no information that a user may use as financial or investment advice. All rights reserved. Oraclum Capital LLC.
And, as always, don’t forget to share & subscribe!



Hello,
Thank you for sharing the week-by-week performance data of the fund. I took some time to analyze the reported weekly gains and losses. When calculated using compound interest, the overall return for this time period appears to be approximately +4.89%.
Could you please elaborate on how the +15% return was calculated? I'm interested in understanding the methodology behind this figure.
Best regards,
Igor