Quick summary:
New survey is up & running - click here.
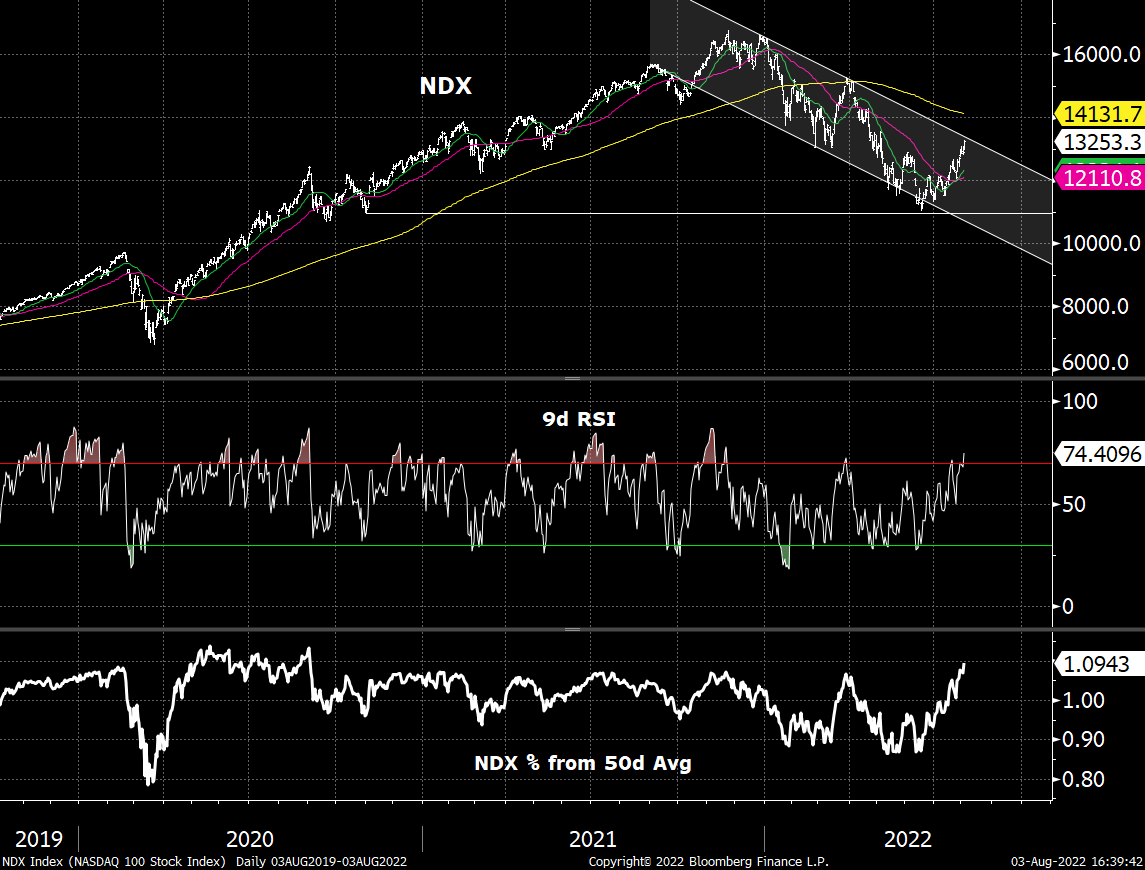
There was a 10% market rally over the past month
Will it continue or have we reached a potential inflection point?
Read on, and then you tell me :)
Also, we are testing a new strategy with the BASON
Welcome dear subscribers, we’re back with the survey! The competition is officially open for week 6 in Q3 2022 (w4 and w5, as you know, were off). The leaderboard is updated and available within the app. You know the game: get in, have your say on our 5 indicators and 2 stocks, take opportunity from our early info on price targets, and keep pushing for that $2000 prize!
Note: If you haven’t already, don’t forget to leave your email after you finish the prediction, so that we can send you early results on Wednesday - see the end of the post.
For all those new to the whole thing, watch this quick video guiding you through the survey, showing you all its features, and briefly explaining how the competition works:
Thanks for participating, and keep having fun!
Is the rally coming to a close?
You probably noticed that markets went through a sustained bear market rally of about 10% since early July. Despite having another high inflation print on July 13th (9.1% CPI), and the Fed hiking another 75bps two weeks later bringing the FOMC rate to 2.5%, the rally continued.
Why? Well, investors were hooked on a so-called Fed pivot (and a potential ‘soft landing’) - Powell said that by raising rates to 2.5% they’ve reached a neutral level of interest rates (in theory this means the equilibrium rate for which the economy achieves full employment; in practice it means that from this point on, further hikes are considered restrictive monetary policy). Powell also said the Fed will be data-oriented in making their calls on future hikes.
One such important data point was the employment number last week, where the US labor market continued its strong job performance. This was good news for the economy (and the White House), but bad news for the Fed, as it means that the rate is certainly not at neutral, and that the wage-price spiral is continuing to go up.
Also, the bond market reaction was significant. The 2-year yield spiked after the jobs report, and we now have an even deeper 2Y10Y inversion (over 40bps by now, biggest since 2000). Remind yourself why this is the most important recession indicator that exists.
Another important data point will be the new inflation print coming out this week on Wednesday. To see what to expect, keep in mind how this number is being calculated: it’s the sum of 12 monthly price changes. The table below shows the monthly CPI data. The read for July 2022 will remove the 0.9% read from July 2021 and replace it with whatever we got last month. The subsequent inflation prints will remove 0.5%, 0.3%, and 0.4%, replacing them with new 2022 data. Do you expect inflation to start going up or down? Energy prices have gone down, sure, but housing and food haven’t. Will be an interesting print to watch.
Furthermore, the technical trend is still downward, and many analysts are suggesting we are reaching an overbought situation (like we had in March this year). I recommend this really good piece on bear market rallies by Mr Blonde (subscribe to his newsletter, good stuff!), with the corresponding image titled “one step forward, two steps back”:
Obviously, this doesn’t need to mean anything, but do keep in mind that big players in the markets love to watch out for technical inflection points (both overbought and oversold like we had in June). Just a thought.
Also, this is kinda cool and people seem to like it, even though I don’t really subscribe to time series graphs being drawn against each other - a correlation can always break away, don’t forget that.
But it’s not just the technicals. Overall, not much has changed structurally since I wrote this piece. I closed most shorts back then, kept half of my SPY short with a large hedge position (so as to be net neutral), but will reopen a few new short positions now. With stop-losses and hedges ofc.
BASON rocking on!
Now, how can the BASON be helpful here?
As always it can tell us what’s gonna happen by the end of each week, and help us seize a potential trend reversal.
We had some time to run through the data and found some very interesting things. We’ll keep posting them from time to time, but for now, we just wanna show you one cool thing we found.
Specifically, we were looking for an alternative strategy to our standard options iron condors and hedges that could be profitable. We found that a simple long-short strategy works really well for all indicators we have predicted. So no options to amplify the gains, just a simple buy order when direction suggests it’s going higher and a sell order when direction suggests it’s going lower.
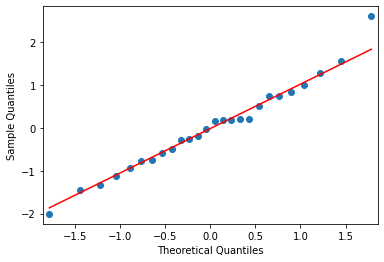
One indicator stood out in terms of performance, the VIX, the S&P volatility index. Now, we never took the VIX predictions too seriously since its errors were quite substantial each week (due to its very high volatility). You can see this in its distribution graph and its qq-plot.
But if we just focus on direction instead of precision, where we go long VIX if its Friday BASON prediction is higher than its Wednesday open, and short vice-versa, we get a stunning 149% return over 27 trading weeks.
VIX
Return: 149.19 % Sortino: 28.08 Trading weeks:  27
We will be testing this strategy from now on. More on that on Thursday (and tomorrow for those who finish the survey and get the trading signals).
So without further ado…
…join the competition!
Participate in our survey competition regularly to get our predictions on Wednesday and take opportunity from our early info on price targets.
NOTE: Remember, by participating in the competition and leaving your email in the user profile, you get our predictions before everyone else (on Wednesday after the markets open). Leaving your email is the only way for us to contact you. If you want it, ofc.

DISCLAIMER: This prediction survey is still in its testing phase. Neither the survey nor its results act as investment advice of any kind. The results of the survey need not correspond to actual market preferences or trends, so they should be interpreted with caution. Oraclum bears no responsibility for your investment choices based on these predictions.
And, as always, don’t forget to subscribe to the newsletter!


