Predicting markets for 12 weeks: incredible accuracy + realized profits
The BASON could be used to make sustainable short-term profits.
If you’re following this newsletter you’re probably doing so because of our weekly market predictions, or to be more precise, our weekly testing of how the BASON - the same method that called Brexit and Trump in 2016, Biden in 2020, and has predicted numerous COVID-related economic consequences - is handling predictions of 6 key market indicators: Bitcoin, the 10-Year T-bill yield, the Dow, S&P500, the price of WTI crude oil, while the final indicator was initially the EUR/USD exchange rate, but then we switched it to Dogecoin until week 8, and for the past 4 weeks it was replaced by the VIX.
We’ve been running it as a survey competition on Twitter where we asked traders and other stock market enthusiasts to give their predictions on the weekly movements of the aforementioned indicators. The survey (available here via our app) was open for only 24 hours each week (from Tuesday 8am EST to Wednesday 8am EST), and the users were asked to predict the value of the indicators for the end of trading day Friday (4pm EST) of the same week.
So far, 3 months of testing are behind us. A total of 12 weeks, from May 3rd to July 30th. The results? Incredible. Beyond of what we were hoping to accomplish.
The graphs below paint the full picture.
S&P500 and DJI
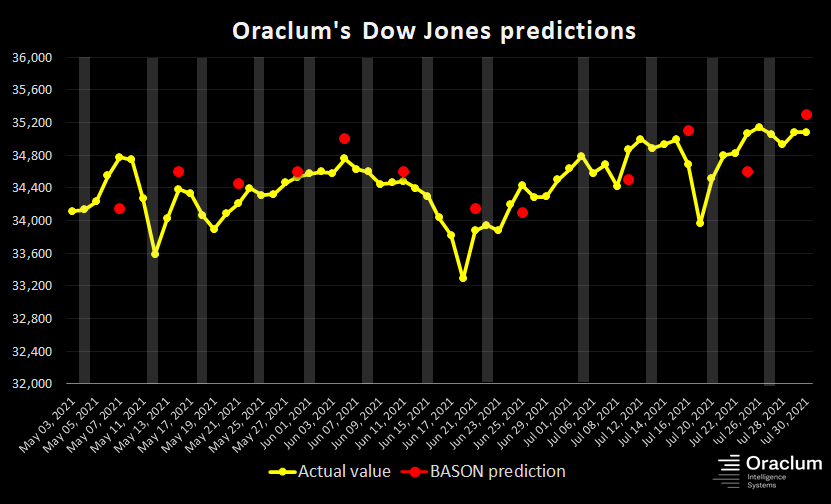
The yellow lines are the actual values and the red dots the predicted values. The shaded areas are the days when the predictions were being made.
In each of the 12 weeks, the two key market indices, S&P and the Dow were called within 2% margin of error. In 10 out of 12, they were called within 1% margin of error. Only for weeks 10 and 11 did it break the 1% margin, with those two weeks representing a period of increased volatility of the indices. Initially we discussed that our method is more accurate when volatility is lower, but even then for DJI and S&P BASON’s margin of error was still 2-3 times below the weekly volatility (the margin of error was 1.2% and 1.3% for the Dow and 1.7% for the S&P in those two weeks).
In every other week, as the graphs indicate, the BASON produced pinpoint accuracy.
BTC, 10-year yield, and oil
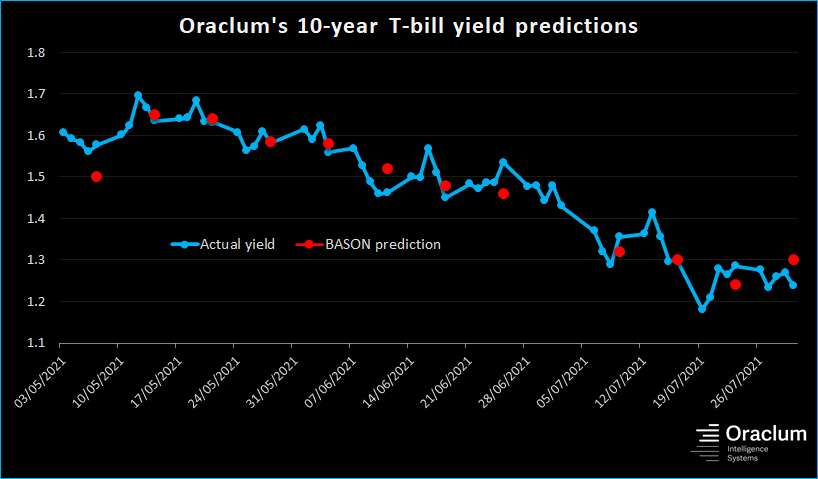
The following graphs show our accuracy for the other three indicators we were predicting throughout the full 12 weeks: Bitcoin, the 10-year yield, and oil prices.
Two things stand out: Bitcoin predictions had large errors in those turbulent May weeks, and then they evened out to almost perfect predictions in the last 4 weeks. Bitcoin’s decline during mid May surprised many, and with weekly volatility between 20 and 30% it was no wonder the predictions were off (although still considerably lower than the weekly volatility). Interestingly, even with increased volatility during the past few weeks, BASON’s accuracy was unharmed; quite the contrary, it was even better than before.
The opposite trend happened with the predictions of oil prices: pinpoint accuracy throughout and then slightly off in the final few weeks when the volatility in oil prices increased significantly.
The 10-year yield predictions were more or less consistent throughout. A few off weeks, but the general direction was called correctly.
As we’ve concluded last time, these results are highly encouraging. Whether the indices were going up, down, or trading sideways for the week, our BASON method managed to capture not only the direction but also the magnitude of the move in the vast majority of times across all indicators. Most importantly, this level of short-term accuracy inspired us to think of the next steps.
Profits collected
Can these predictions be used to make money? This is the key question.
The answer is yes, although the risk-reward potential is somewhat skewed simply because we’re only doing short-run, week-by-week predictions.
Allow me to clarify.
The figure below shows trading profits (and losses) achieved when using BASON predictions to trade options for the SPY index (an ETF following the S&P500). It starts at Week 6 when we first tested this strategy with real money. We started publishing our profits/losses since week 9.

As explained several times before in this newsletter, we applied a simple iron condor options strategy (when you bet that the market will move sideways, i.e. end up between certain intervals. The BASON prediction is ideal to choose those intervals since it gives its predictions within 1-2% C.I.s). For Week 12, we announced an additional strategy - purchasing in-the-money SPY call options where the strike price is the lower confidence interval of the BASON prediction (at 436 for that week). This made us just over $400 at the Friday close.
Applying the iron condor would have made money not only in 6 out of 7 weeks when we actually applied it; it would have also made money in the first 5 weeks. Therefore only week 10 would have produced a loss, and only because we chose 1% instead of 2% confidence intervals for our prediction, while the SPY broke the 1% interval and landed a margin of error of 1.7% that week (that Friday marked a sell-off that continued on Monday).
One might think that dwelling on such small percentages is silly, but because of the short-term nature of our investments (or let's face it, bets), 20 or 50 basis points (0.2 or 0.5%) can make all the difference between a profit or a loss. A too wide margin (say 300 or 400 basis point intervals), would make the risk-reward spread waaay too small. In other words, we would be exposed with a lot more money than we could profit (e.g. stand to lose $1200 if it goes wrong but win only $100 if it goes right).
The problem with asymmetry
This is the main issue with the investing strategy coming from applying the BASON for an end-of-week prediction. It offers a slightly asymmetric bet, but in the wrong direction. For example, each week we pick an iron condor where we can lose a maximum of $600, but can gain only $360 (before brokerage fees). This is asymmetric because you stand to lose more if the trade goes against you than what you can gain if it goes in your direction. Same with the call (or put) option that expires in 3 days. Last week we bet $1000 to win $400. 40% is not a bad return, but if the call expired worthless we would have lost the full $1000.
That’s what makes the risk-reward asymmetric in the wrong direction. Ideally you would like to have an asymmetric trade where you stand to lose very little if you’re wrong and can win big if you’re right (e.g. a strategy that Ackman used in March 2020 to gain a $2bn profit with only $27m exposure, or the Black Swan strategy used by Spitznagel’s Universa fund (Taleb is an advisor there) in 2008 and again in 2020 for a 4000% return). Great investors are always on a lookout to take advantage of very asymmetric bets, where loses are limited and small, but if you’re right - you win big.
(NOTE: Usually, in finance, an asymmetric bet is always considered to be exactly this: lose small, win big, so apologies to experienced traders for the confusion).
Of course, we could always put a stop-loss order and cut our losses so as to skew the risk-reward asymmetry in our direction. We could have done this in Week 10 as well, but we deliberately let the options expire worthless simply to show the worst case scenario. This is still in its testing phase after all. Had this been more money, we would have pulled out on Friday morning having seen the market moving beyond our 1% C.I., limiting the loss at 30%, and losing only around $200.
So far we bought/sold small amounts: 10 iron condors, 2 call options. In total we made a net profit of $1820 during 7 weeks. If we had bought 100 or 1000 or 10,000 contracts the profits would have been much larger obviously. Problem is, the more contracts you move, the more difficult it is to sell them on the Friday of the expiry date when they start moving against you. In other words it would have been more difficult to cut potential losses (for that one week when they happened). In all the other weeks, however, we would have been fine, and would have had no problem cashing in the winnings.
If the past 12 weeks are a good metric of precision of the BASON being applied to markets, we can say that annually we would have seen 4 or 5 bad weeks, and 47-48 profitable ones. This gives us reassurance of skewing the asymmetry back in our favor.
Stay tuned to see how this will play on in the months ahead.
What’s next?
If you came this far, kudos! And thanks for paying attention!
The survey will be off during August, and will recommence in September, possibly with some more changes designed to make it a better user experience. It will carry on its testing phase for a few more months and then we are hoping to offer our users a potential to join us in profiting off the BASON.
Until then, we’ll keep the newsletter alive by informing you of what’s happening in the markets, and with further interesting analyses coming from our survey.
Thank you for following us, and if you’re new to the newsletter, don’t forget to subscribe!


